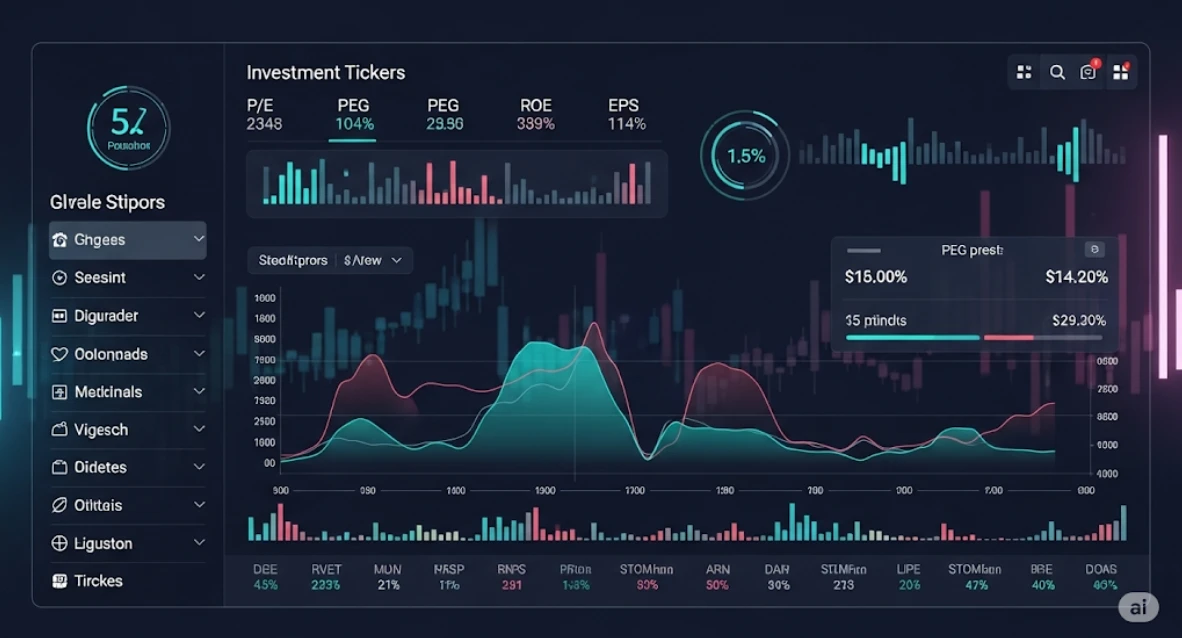
In the age of data-driven investing, it’s no longer enough to go with your gut or pick stocks based on brand familiarity. Today’s investors, from beginners to professionals, increasingly rely on AI screeners to sift through thousands of stocks in seconds. But knowing what these AI tools show you—and how to interpret the numbers—is just as important.
In this guide, we’re diving into understanding AI screener metrics: P/E, PEG, ROE, etc., so you can confidently evaluate companies using the power of artificial intelligence.
Whether you’re using free AI screeners or premium platforms, these metrics are foundational. And with AI analyzing them for you, your job is to understand their meanings, context, and implications for performance.
Let’s break it down.

🤖 What Are AI Screener Metrics?
AI screener metrics are key financial indicators that AI tools use to evaluate and rank stocks. These metrics can be:
Fundamental (like P/E, PEG, ROE)
Technical (like RSI, MACD)
Sentiment-based (like news sentiment or insider activity)
Proprietary AI scores (like AI confidence scores or smart rating indexes)
In this article, we’ll focus on fundamental AI screener metrics like P/E, PEG, and ROE—because these are the bedrock of intelligent long-term investing.
🧮 Metric #1: Price-to-Earnings (P/E) Ratio
📌 What is P/E?
The P/E ratio compares a company’s current stock price to its earnings per share (EPS).
Formula:
P/E = Price per Share ÷ Earnings per Share (EPS)
🤔 What Does It Tell You?
A low P/E might mean a stock is undervalued.
A high P/E could indicate overvaluation—or high growth expectations.
✅ How AI Uses It:
AI screeners compare P/E ratios across industries, time periods, and competitors. The AI doesn’t just flag “low” or “high”—it detects patterns.
For example, if a stock has a lower-than-average P/E but rising earnings and good sentiment, AI might highlight it as a value opportunity.
📈 Metric #2: Price/Earnings-to-Growth (PEG) Ratio
📌 What is PEG?
The PEG ratio adjusts the P/E ratio for a company’s expected growth rate.
Formula:
PEG = P/E ÷ Annual EPS Growth Rate
🤔 Why It Matters:
A stock with a high P/E might still be a good buy if it’s growing fast. PEG helps answer this question.
PEG < 1: Possibly undervalued
PEG > 1: May be overvalued relative to growth
✅ How AI Uses It:
AI screeners use PEG to spot growth-at-a-reasonable-price (GARP) stocks. Combining PEG with other AI indicators helps investors find rising stars before the crowd does.
💡 Metric #3: Return on Equity (ROE)
📌 What is ROE?
ROE measures a company’s profitability based on shareholder equity.
Formula:
ROE = Net Income ÷ Shareholder Equity
🤔 What It Reveals:
ROE tells you how effectively management is using your money. Higher ROE means stronger performance and capital efficiency.
✅ AI in Action:
AI doesn’t just list ROE numbers—it tracks ROE trends and benchmarks them against sector averages. A rising ROE may trigger a buy signal when combined with low debt and strong earnings.
📊 Metric #4: Debt-to-Equity Ratio (D/E)
📌 What is D/E?
D/E shows how much debt a company uses relative to shareholder equity.
Formula:
D/E = Total Liabilities ÷ Shareholder Equity
🤔 Interpreting the Number:
Low D/E = financially stable
High D/E = riskier, especially during downturns
✅ AI Screener Utility:
AI alerts investors when D/E is climbing too fast, helping manage portfolio risk. Combined with macroeconomic indicators, AI may flag companies vulnerable to interest rate hikes.
📉 Metric #5: Earnings Per Share (EPS)
📌 What is EPS?
EPS is a measure of a company’s profitability on a per-share basis.
Formula:
EPS = (Net Income – Dividends on Preferred Stock) ÷ Shares Outstanding
🤔 Why It’s Key:
EPS is the backbone of valuation ratios like P/E and PEG. It’s also a powerful standalone metric.
✅ AI Screener Advantage:
AI can analyze EPS trends over time, not just the latest number. It can compare quarterly growth, forecast future EPS, and detect EPS surprises—helping investors act quickly.
🔍 Metric #6: Price-to-Book (P/B) Ratio
📌 What is P/B?
P/B compares a stock’s price to its book value (the company’s net assets).
Formula:
P/B = Stock Price ÷ Book Value per Share
🤔 When It Matters:
P/B < 1: Stock might be undervalued
P/B > 3: Often considered overvalued
✅ How AI Uses It:
AI combines P/B with ROE and sector data to filter deep value plays. Some AI models even calculate adjusted book value using alternative data inputs.
📅 Metric #7: Free Cash Flow (FCF)
📌 What is FCF?
FCF is the cash a company generates after expenses and capital expenditures.
🤔 Why You Should Care:
Strong FCF means a company can reinvest, pay dividends, reduce debt, or buy back shares.
✅ AI Screener Integration:
AI highlights FCF trends and flags companies whose cash generation doesn’t align with profits, potentially uncovering accounting red flags.
💬 Bonus: Sentiment & AI Confidence Scores
While not traditional metrics, many AI screeners now include:
News sentiment analysis (positive/neutral/negative)
AI confidence scores (probability-based risk assessments)
These scores combine multiple metrics (P/E, ROE, PEG) with external data (news, earnings, macro events) to help users make confident decisions.
📚 Case Study: How AI Uses These Metrics in Action
Imagine you want to find mid-cap U.S. growth stocks with strong fundamentals. You set the following filters in your AI screener:
P/E < 20
PEG < 1.2
ROE > 15%
FCF positive for 3 years
EPS growth > 10% annually
The AI returns five stocks and ranks them using real-time sentiment analysis, insider activity, and earnings momentum.
This is AI-enhanced due diligence—fast, data-driven, and powerful.
🧭 How to Start Using These Metrics
Here’s a quick start guide to using AI screeners for understanding P/E, PEG, ROE, etc.:
Step 1: Choose a Screener
Top free AI screeners include:
Step 2: Filter by Metrics
Set filters based on P/E, PEG, ROE, FCF, and D/E.
Step 3: View AI Rankings
Many platforms offer AI-based smart scores based on your chosen metrics.
Step 4: Save & Monitor
Add the best stocks to your AI-powered watchlist. Use alerts for metric shifts or news sentiment changes.
⚠️ Common Mistakes When Using AI Metrics
Isolating a single metric (e.g., relying only on P/E)
Ignoring context (e.g., comparing tech and utility stocks using the same PEG)
Overreacting to one bad quarter
Trusting AI blindly—it’s a tool, not a guarantee
Understanding AI screener metrics: P/E, PEG, ROE, etc. means knowing how to interpret them with common sense and broader market context.
🔮 The Future of AI Metrics in Investing
Expect AI screeners to evolve with:
Real-time ESG scoring
Behavioral sentiment modeling
Dynamic portfolio optimization based on metric signals
Voice-activated financial screening bots
AI won’t replace your judgment—but it will make your research faster, deeper, and smarter.
✅ Final Thoughts
Understanding AI screener metrics: P/E, PEG, ROE, etc. is the foundation of intelligent investing. With AI surfacing the data and trends, your job is to interpret the metrics and make informed decisions.
Here’s your takeaway:
Use P/E and PEG to value stocks
Rely on ROE and FCF for profitability
Check D/E to gauge financial stability
Track EPS for earnings power
Trust AI to do the heavy lifting—but verify before buying
As AI screeners become smarter and more accessible, understanding these core metrics ensures you’re not just using tech—you’re investing like a pro.
🔗 Related Reads You Might Like:


Pingback: 7 Best Free AI Screeners for Beginner Value Investors (2025 Edition) - Trade Pluse Ai