Discover the anatomy of an AI generated stock report in this detailed guide. Learn how free AI tools analyze, format, and deliver powerful insights for investors.
In today’s data-driven financial world, stock market insights are no longer exclusive to elite analysts or institutional investors. Thanks to artificial intelligence (AI), individual traders and beginner investors now have access to detailed stock reports generated in seconds—many of them completely free.
But what exactly goes into these reports? What makes them different from traditional analysis? This guide breaks down the anatomy of an AI generated stock report (free version) to help you understand what to expect, how to use the information, and what limitations to keep in mind.
Let’s decode the AI-driven report and discover how free tools can transform your investment decision-making.
💡 Why AI-Generated Stock Reports Matter
Traditional stock reports involve hours of manual research and interpretation. They often require financial literacy and access to premium databases. An AI generated stock report, however, leverages:
Machine Learning for trend prediction
Natural Language Processing (NLP) to analyze news and sentiment
Real-time Data Processing for current metrics
These reports provide fast, consistent insights, making them perfect for both beginners and time-constrained investors.
🧠 Core Components of an AI-Generated Stock Report
Let’s break down the essential elements you’ll find in most free AI generated stock reports.
1. 🪪 Stock Overview and Identity
The first section offers a snapshot of the stock:
Ticker Symbol & Exchange
Company Name & Sector
Market Capitalization (Large-Cap, Mid-Cap, etc.)
Current Price and Change (Daily/Weekly)
✅ Purpose: Gives users an immediate identity check before diving deeper.
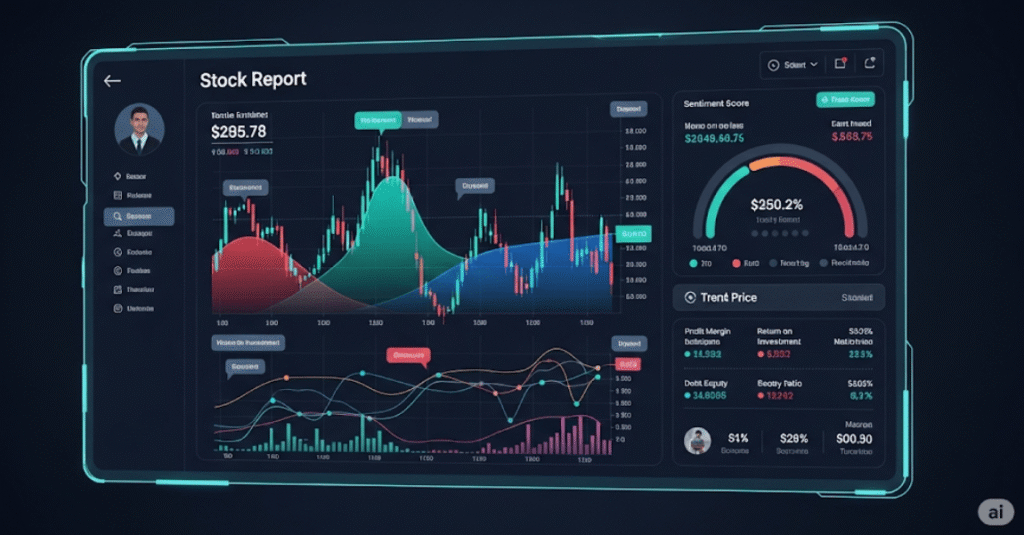
2. 📉 Price History & Trend Visualization
AI reports often generate visualizations of:
Historical Price Charts (1D, 1W, 1M, 1Y)
Trendlines (Support/Resistance)
Price Volatility Indicators
AI models use past data to draw projected movement lines or even simulate short-term forecasts based on regression or time-series models.
✅ Purpose: Shows momentum and entry/exit zones.
3. 📊 Technical Indicators and AI Signals
AI generated reports commonly include automated analysis of:
Relative Strength Index (RSI)
MACD (Moving Average Convergence Divergence)
Simple/Exponential Moving Averages (SMA/EMA)
AI Buy/Sell Signals
These indicators are powered by machine learning models trained to spot key market behavior.
✅ Purpose: Helps traders identify trends and reversals without manually crunching indicators.
4. 📰 News Sentiment Analysis
This section is where NLP comes into play. AI scours headlines, financial news, and press releases to assign:
Sentiment Score (Positive/Neutral/Negative)
Trending Keywords
Volume of Mentions
Some reports even break this down into sentiment over time—showing if the stock has been gaining favor or falling under scrutiny.
✅ Purpose: Combines qualitative media input with quantitative signals.
5. 📈 Predictive Modeling: AI Forecasts
One of the most valuable parts of an AI generated stock report (free version) is the forecast section:
Short-Term Price Prediction (1–5 Days)
Medium-Term Projection (1–4 Weeks)
Confidence Score (%)
These predictions are usually powered by models like LSTM, neural networks, or support vector machines, depending on the provider.
✅ Purpose: Offers probability-based expectations to guide decisions—not guarantees.
6. 💵 Fundamental Analysis (Simplified)
Some free AI tools scrape basic financial ratios, including:
Price-to-Earnings (P/E)
Debt-to-Equity (D/E)
Earnings Per Share (EPS)
Dividend Yield
This is a condensed version of deep fundamental research and may be limited depending on data access.
✅ Purpose: Gives a quick scan of the company’s financial health.
7. 📌 Peer Comparisons & Sector Ranking
AI tools often analyze similar companies and compare the stock’s performance and metrics against:
Sector Peers
Market Leaders
Benchmark Indices
Visuals like radar charts or heat maps are used to rank stocks on performance, valuation, or risk.
✅ Purpose: Contextualizes the stock within its ecosystem.
8. 📋 Risk Analysis
AI-generated risk sections might include:
Beta Value (Market Volatility)
Drawdown Scenarios
Backtest Performance
News-based Risk Factors
Some tools also generate a “Risk Rating” on a scale of 1–5 or Low–High.
✅ Purpose: Helps manage expectations and capital allocation.
9. 🤖 Model Transparency (If Available)
Some AI tools give you a breakdown of how the report was built:
Type of Model Used (e.g., Decision Tree, LSTM)
Dataset Sources (e.g., Yahoo Finance, Quandl, news APIs)
Training Period or Limitations
This is rare in free versions but valuable when included.
✅ Purpose: Builds trust and allows for better user judgment.
📱 Top Free Platforms Offering AI Generated Stock Reports
FinBrain.tech – Sentiment and pattern analysis with charts
Tickeron – Pattern-based AI signals and predictions
Ziggma – Stock scores and analysis dashboards
TipRanks (Free Version) – Analyst AI-based consensus
Simply Wall St (Free Plan) – Visual, fundamentals-heavy reports
All of these platforms simplify the anatomy of an AI generated stock report for free or with limited use tiers.
🛠️ How to Read and Use an AI Stock Report (Free Version)
✅ Do:
Compare signals with other research
Use sentiment + trends together
Monitor predictive confidence
Use peer comparison for confirmation
❌ Don’t:
Trade solely on AI-generated signals
Ignore broader macroeconomic news
Assume high prediction = guaranteed outcome
Use these tools as assistants, not decision-makers.
⚠️ Limitations of Free AI Stock Reports
While powerful, the free version of AI-generated stock reports does have constraints:
| Limitation | Explanation |
|---|---|
| Data Access | Often limited to public sources |
| Forecast Timeframes | Typically short-term only |
| Model Complexity | Simpler algorithms than paid tiers |
| Personalization | Less tailored to your portfolio |
| Depth of Financials | Lacks full financial statement data |
These limitations don’t make them useless—just incomplete for high-stakes decisions.
🧩 Integrating AI Reports Into Your Workflow
Start with one report per stock you’re analyzing. Use it to:
Screen ideas quickly
Validate technical levels
Gauge public sentiment
Flag red flags automatically
Pair this with your own risk appetite and strategy. Over time, you’ll learn how to judge when the AI gets it right—and when to double-check.
🧠 Final Thoughts: A New Era of Smart, Accessible Analysis
Understanding the anatomy of an AI generated stock report (free version) allows you to unlock actionable insights without being an expert. While premium tools offer deeper dives, free reports are often sufficient for getting ahead of the average retail investor.
The key is to not treat these reports as a crystal ball—but as a valuable second opinion powered by fast, scalable, and unbiased computation.


Pingback: 5 Key Limits: Understanding AI’s Limitations in Bear vs. Bull Markets - Trade Pluse Ai