Introduction: What Are AI-Generated Channel Lines on Charts?
If you’re navigating the world of technical analysis, you’ve likely heard of trendlines and channels. But with AI tools entering the trading space, AI-generated channel lines on charts have taken this classic technique to the next level.
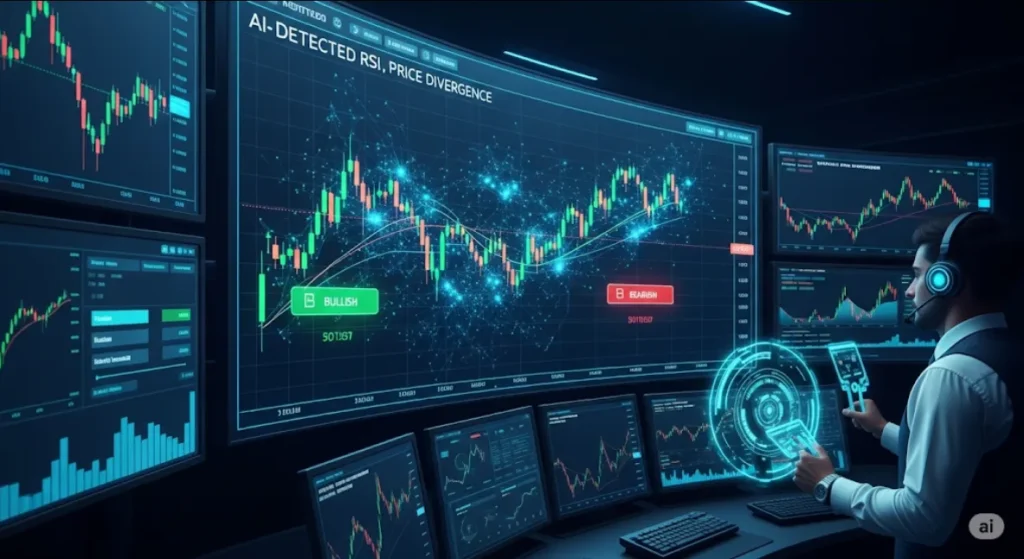
In simple terms, AI-generated channel lines are automatically drawn lines that help visualize price trends within upper and lower boundaries, also known as a price channel. AI algorithms analyze historical price action, volatility, and patterns to plot these lines instantly—saving traders time and reducing human bias.
In this guide, we’ll break down:
✅ What AI-generated channel lines are
✅ Why they matter for traders
✅ Top free tools offering AI charting features
✅ How to use them effectively
✅ Pro tips to combine AI channels with your strategy
Let’s dive in! 🚀
Why AI-Generated Channel Lines on Charts Are Game-Changers
Traditional traders manually draw channels based on price highs and lows, requiring skill and time. AI flips the script by:
💡 Automating Trend Detection: AI scans vast price data to find accurate trend channels
💡 Reducing Human Error: No more subjective lines; AI uses data-driven calculations
💡 Spotting Hidden Patterns: AI detects micro-trends and unconventional channels
💡 Saving Time: Instant channel plotting, ideal for fast-moving markets
With AI-generated channel lines on charts, traders get a real-time, objective view of market trends and potential breakout zones.
How AI Generates Channel Lines: Behind the Scenes
Curious how AI draws those clean, precise lines? Here’s how it works:
1️⃣ Data Collection
The AI ingests historical price data, focusing on:
Highs and lows
Support and resistance levels
Volatility bands
2️⃣ Pattern Recognition Algorithms
Advanced AI models, often based on machine learning (ML) or deep learning, scan for:
Parallel price movements
Ascending or descending channels
Regression-based trend boundaries
3️⃣ Dynamic Adjustment
Unlike static trendlines, AI-generated channels adjust as new price data arrives, offering adaptive insights in real-time.
Many platforms use algorithms similar to Linear Regression Channels, Keltner Channels, or Donchian Channels, but AI enhances detection accuracy and responsiveness.
Top Free Tools for AI-Generated Channel Lines on Charts
Want to try this for free? Here are popular tools providing AI-generated channel lines:
🛠️ 1. TradingView (Free Tier)
AI-assisted channel drawing
Smart trendline suggestions
Dynamic channel updates in real-time
Basic access free; pro plans offer more AI features
🛠️ 2. TrendSpider (Free Trial Available)
🌐 TrendSpider Automated Technical Analysis
AI-drawn trendlines and price channels
Multi-timeframe channel detection
Automated backtesting with AI insights
Paid plans with trial periods
🛠️ 3. Finviz (Limited Free Features)
AI-inspired chart patterns, including channels
Visual breakout zone detection
Free for basic charting; advanced tools require upgrade
Note: Always check each platform for up-to-date free options, as AI features may be tiered.
Types of AI-Generated Channel Lines You Should Know
AI tools can detect several key channel types:
📊 Ascending Channels (Bullish Trend)
Upper and lower lines slope upward
Indicates sustained price uptrend
AI identifies breakout or breakdown risks
📉 Descending Channels (Bearish Trend)
Both lines slope downward
Suggests price downtrend continuation
AI pinpoints reversal signals
🔄 Horizontal Channels (Sideways Market)
Flat upper and lower boundaries
Represents consolidation phase
AI can highlight breakout probabilities
Understanding these AI-drawn channels helps traders align entries, exits, and risk management with market structure.
How to Use AI-Generated Channel Lines on Charts: Step-by-Step
Ready to integrate AI channels into your trading? Follow these steps:
Step 1: Choose Your Platform
Sign up for platforms like TradingView, TrendSpider, or Finviz with AI charting.
Step 2: Select Your Chart and Asset
Load charts for stocks, forex, crypto, or commodities.
Step 3: Enable AI Channel Detection
Look for options like:
✅ Smart trendline suggestions
✅ Auto-channel overlays
✅ AI pattern recognition
Step 4: Analyze the Channel
Interpret:
✔️ Trend direction (bullish, bearish, sideways)
✔️ Proximity to upper/lower boundaries
✔️ Breakout potential
Step 5: Confirm with Other Indicators
Boost reliability by combining AI channels with:
RSI or MACD for momentum confirmation
Volume spikes for breakout validation
Price action candlesticks
Example: AI-Generated Channels on a Tesla Chart
Imagine Tesla (TSLA) stock showing an ascending AI-generated price channel:
✅ Price consistently respects upper and lower trendlines
✅ AI adjusts channels dynamically after earnings gaps
✅ Upper boundary breaches hint at breakout momentum
By combining AI channels with volume surge and RSI strength, traders can confidently ride the trend.
Pro Tips for Mastering AI-Generated Channel Lines on Charts
🚀 Combine with Human Oversight: AI provides precision, but traders should validate signals
🚀 Avoid Overfitting: Trust dynamic channels over rigid, outdated lines
🚀 Use Multiple Timeframes: AI channels vary by timeframe—analyze daily, weekly, and intraday views
🚀 Watch for Breakouts: Upper/lower channel breaches often signal trend acceleration or reversals
🚀 Pair with Risk Management: Channels help define stop-loss and profit targets
Common Mistakes to Avoid
⚠️ Blindly trusting AI without understanding market context
⚠️ Overcomplicating charts with overlapping AI channels
⚠️ Ignoring fundamental news impacting price action
AI-generated channel lines are tools—not guarantees—so always blend AI insights with technical and fundamental analysis.
AI-Generated Channel Lines vs. Manual Channels: Quick Comparison
| Feature | Manual Channels | AI-Generated Channels |
|---|---|---|
| Time Efficiency | Time-consuming | Instant, real-time |
| Accuracy | Subjective | Data-driven precision |
| Pattern Detection | Limited | Spots hidden trends |
| Learning Curve | High | Beginner-friendly |
| Adjustment to New Data | Manual Redraw | Automatic Updates |
Conclusion: Why AI-Generated Channel Lines on Charts Belong in Your Toolkit
In today’s fast-paced markets, speed, accuracy, and objectivity are vital. AI-generated channel lines on charts empower traders to:
✅ Visualize trends clearly
✅ Identify breakout zones early
✅ Eliminate guesswork
✅ Trade with confidence
Whether you’re day trading stocks or investing long-term, integrating AI-driven channels with your strategy can boost your technical edge.
🔗 Related Reads You Might Like:


Pingback: How AI Detects Candlestick Reversal Patterns: Doji, Hammer, Engulfing (2025) - Trade Pluse Ai