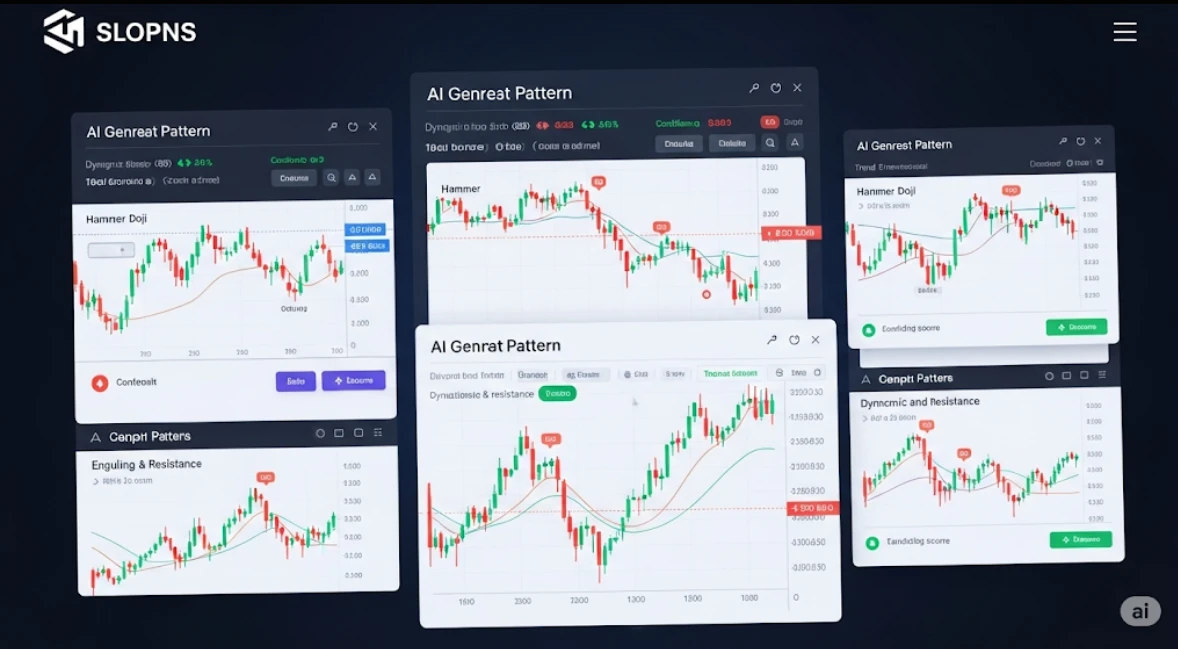
Interpreting AI-Generated Candlestick Formations: Smarter Trading Decisions
Candlestick patterns remain one of the most powerful tools in a trader’s technical arsenal. From dojis and hammers to engulfing and evening stars, these formations offer visual insights into market sentiment. But interpreting them can be subjective—unless AI is involved.
Enter AI-generated candlestick formations.
Modern AI tools automatically detect and interpret candlestick patterns across multiple timeframes, reducing guesswork and enhancing the accuracy of technical analysis. In this article, we’ll explore how these tools work, what they offer traders, and how to use them to improve decision-making.

🕯️ What Are Candlestick Formations?
Candlestick formations are visual patterns formed by one or more candlesticks that reflect market psychology and momentum. Popular patterns include:
Bullish Engulfing
Bearish Harami
Doji
Morning Star
Hammer
Shooting Star
Three White Soldiers
These patterns help traders:
Predict trend reversals or continuations
Gauge market indecision
Identify potential breakout zones
🤖 How AI Enhances Candlestick Pattern Recognition
Traditional pattern recognition is done manually—by scanning hundreds of charts and memorizing dozens of formations. But humans are prone to error, fatigue, and bias.
That’s where AI-generated candlestick formations provide a major edge:
✅ Benefits of AI in Candlestick Interpretation:
| Feature | Advantage |
|---|---|
| Speed | Analyzes hundreds of assets in seconds |
| Accuracy | Identifies valid patterns with precise criteria |
| Consistency | Applies the same rules across all charts |
| Real-time Alerts | Instantly notifies traders of high-probability patterns |
| Multi-Timeframe | Detects patterns across 1M, 15M, 1H, Daily, etc. |
🔍 How AI Detects Candlestick Formations
Let’s break down the logic AI uses to identify candlestick formations:
1️⃣ Data Collection
AI systems analyze:
Open, High, Low, Close (OHLC) data
Candle size, wick length, volume
Previous candle context
2️⃣ Pattern Recognition Engine
Using:
Pre-trained algorithms
Historical pattern databases
Deep learning models
AI learns how to match data against known candlestick structures (both single and multi-candle patterns).
3️⃣ Contextual Filtering
AI adds value by analyzing:
Volume confirmation
Proximity to support/resistance zones
Trend direction
Volatility conditions (via ATR)
This gives more meaningful signals rather than raw pattern dumps.
4️⃣ Confidence Scoring
Some AI tools assign a confidence score based on:
Pattern clarity
Trend alignment
Historical success rate of similar setups
🧰 Free AI Tools That Detect Candlestick Formations
Here are the top tools (free or freemium) that provide AI-generated candlestick formation detection:
✅ 1. TradingView AI Scripts
Best For: Custom real-time candlestick pattern alerts
Public Pine Scripts with AI logic detect and label candlestick patterns
Some include probability scores or trend confirmation filters
Works across assets: crypto, stocks, forex, commodities
🔹 Free Plan: Access AI candlestick scripts in the TradingView community (e.g., “AI Candlestick Analyzer”)
✅ 2. MetaTrader 4/5 + AI EAs
Best For: Automated pattern-based strategies
Expert Advisors (EAs) scan candles in real-time
Trade based on bullish/bearish formations
Auto-entry and exit available
🔹 Free Plan: Use open-source MQL5 candlestick AI bots
✅ 3. ChartPattern.com
Best For: Web-based scanning and alerts
Detects single/multi-candle formations
AI-backed pattern verification
Scans across global stocks and cryptos
🔹 Free Access: Limited daily scans and alerts
✅ 4. FinBrain Tech
Best For: Forecast-based candlestick interpretation
AI-generated candlestick formations used to project market movement
Pattern-based forecasting engine
Useful for swing traders
🔹 Free Plan: Basic asset list with candlestick forecasting
✅ 5. TrendSpider (Freemium Trial)
Best For: AI-detected visual pattern overlays
Built-in detection of candlestick patterns
Integrates with trendlines, volume, and other indicators
Offers detailed charting and auto-labels
🔹 Free Trial: 7-day full access
📈 Interpreting AI-Generated Patterns in Trading
Knowing the pattern is just step one. Here’s how to interpret and use the output for actual trades:
📌 1. Pattern Type
First, determine the nature of the pattern:
Reversal: e.g., Hammer, Evening Star
Continuation: e.g., Rising Three, Bullish Marubozu
Indecision: e.g., Doji
📌 2. Trend Context
AI tools often overlay patterns with directional arrows or trend filters.
Example:
A bullish engulfing in an uptrend is stronger than one in a downtrend.
📌 3. Volume Confirmation
Some AI tools display volume spikes alongside patterns:
High volume + bullish pattern = higher confidence in breakout
Low volume = potential fakeout
📌 4. Support/Resistance Zone Proximity
A candlestick pattern forming near:
Support = potential long opportunity
Resistance = possible short setup
AI tools that highlight zones help you validate the setup more accurately.
📌 5. Multi-Timeframe Alignment
Combine pattern detection across:
1H and 4H
4H and Daily
Daily and Weekly
If a bullish pattern appears on both 1H and 4H—confidence goes up.
🧠 Example: AI-Generated Candlestick Interpretation in Action
Let’s say the AI detects:
Bullish engulfing on the 1H chart of EUR/USD
Confidence score: 87%
Pattern formed above a major support zone
Volume spike confirms breakout
What you do:
Validate trend direction (via moving averages)
Set long entry at the next candle open
Stop-loss below the engulfing candle low
Target recent resistance or 1:2 risk-reward
AI gives you clarity and structure, removing hesitation.
⚠️ Mistakes to Avoid with AI Candlestick Tools
| Mistake | Fix |
|---|---|
| Ignoring context (trend/volume) | Always check surrounding conditions |
| Relying solely on pattern | Use confirmation tools like RSI or MACD |
| Overtrading every pattern | Focus on high-confidence signals |
| Not backtesting AI alerts | Run them in replay mode first |
🔗 Related Reads You Might Like:


Pingback: Day Trading Chart Setups with Free AI: Best Tools & Smart Strategies - Trade Pluse Ai