How AI Highlights Momentum Shifts in Trading Charts
Momentum is one of the most powerful forces in trading. Whether you’re dealing with stocks, forex, crypto, or commodities, a momentum shift can mark the start of a new trend—or the end of a profitable run.
But here’s the challenge: human eyes often catch momentum too late.
Fortunately, AI highlights momentum shifts faster, more objectively, and with greater accuracy than traditional manual analysis. This article will walk you through:
What momentum shifts are
How AI detects them in real time
The best tools for the job
Real-world chart examples
How to use AI insights to enter/exit trades smartly
💡 What Is a Momentum Shift?
In technical analysis, a momentum shift happens when the price action starts to slow down, speed up, or reverse its directional energy.
You’ll often see this as:
Divergence between price and indicators (like RSI or MACD)
A sudden volume spike or collapse
A breakout that fails (or a failed breakdown)
A change in slope or volatility
Momentum shifts can signal:
Trend exhaustion
Breakout opportunities
Reversal potential
Entry or exit zones
🧠 How AI Highlights Momentum Shifts
AI uses machine learning, pattern recognition, and real-time data analysis to detect when momentum is changing—even before the chart makes it obvious.
Here’s how AI makes it smarter:
🔍 1. Real-Time Indicator Analysis
AI tracks multiple indicators simultaneously:
RSI
MACD
Stochastic Oscillator
Momentum
Rate of Change (ROC)
It doesn’t just read the numbers. It recognizes patterns of change, like:
RSI flattening after a strong move
MACD histogram shrinking
Stochastics crossing out of overbought/oversold
⚖️ 2. Volume-Momentum Correlation
Volume confirms momentum. AI detects:
Bullish/bearish volume spikes
Volume divergence (price goes up, volume fades)
Exhaustion candles with volume peaks
It alerts traders when volume no longer supports the move—a classic sign of a shift.
🔁 3. Slope and Acceleration
AI tracks the rate of price change, not just the direction.
It highlights:
Loss of slope intensity
Momentum acceleration zones
Deceleration curves (often before reversals)
🧩 4. Pattern-Based Momentum Detection
AI is trained to recognize:
Flags and pennants (consolidation before momentum continues)
Breakouts from compression
Failed patterns = reversal momentum
📉 5. Multi-Timeframe Momentum Alignment
Momentum on the 1-hour chart is weak? No problem—AI checks:
1D, 1W, 4H, 15M charts
Finds confirmation or contradiction across timeframes
Highlights hidden bullish/bearish momentum missed by static analysis
🧰 Best Free Tools Where AI Highlights Momentum Shifts
These platforms offer either free tiers or community tools powered by AI.
✅ 1. TradingView + Community AI Scripts
AI-enhanced momentum indicators like:
“Smart RSI Divergence Detector”
“AI Momentum Squeeze Zones”
Visual cues when price breaks or loses strength
Alerts when momentum is fading or building
🔹 Free Plan: 1 chart layout, 3 indicators, access to public scripts
✅ 2. TrendSpider (Trial or Free Access)
AI auto-draws trendlines and momentum divergence
“Raindrop Charts” combine volume and momentum visually
Momentum scanner for real-time trade ideas
🔹 Free Trial: Full access to smart momentum indicators
✅ 3. Finviz Elite (Free Features + Scanner)
Heatmaps and momentum-based stock screeners
AI-powered scanner shows momentum gainers/losers
Momentum alerts based on price + volume velocity
🔹 Free Tier: Limited chart tools but useful screener insights
✅ 4. MetaTrader 5 + AI Indicators
AI-based indicators like:
“Adaptive Momentum”
“Smart Divergence Detector”
“Volume-Momentum Analyzer”
🔹 Free Tools: MT5 marketplace has free AI-coded plugins
✅ 5. FinRL (Open Source AI for Finance)
Trains AI models to detect shifts in price movement energy
Simulates reactions to changes in trend and volatility
Best for custom or research-based momentum strategies
🔹 Free Plan: Open-source, Python-based
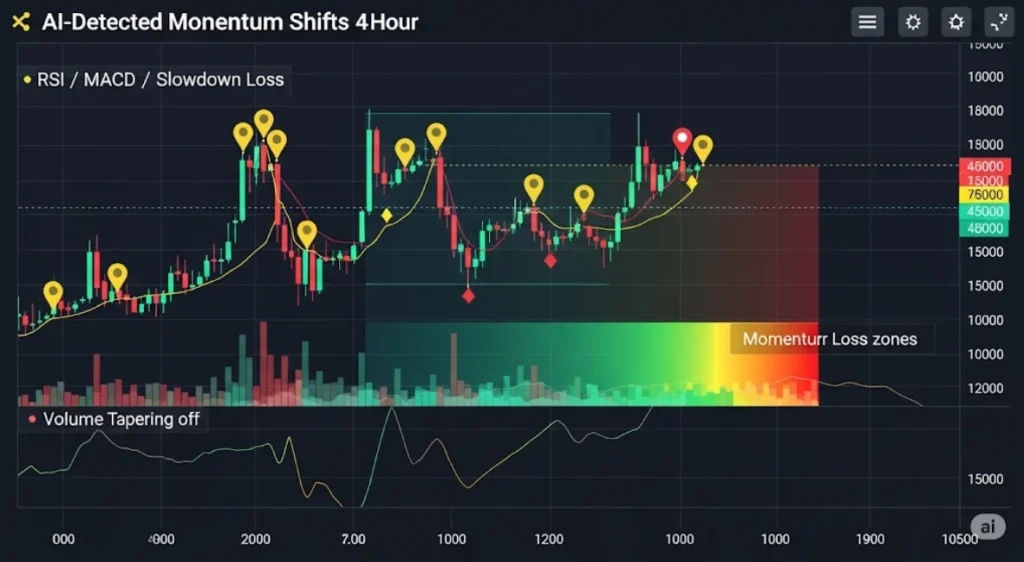
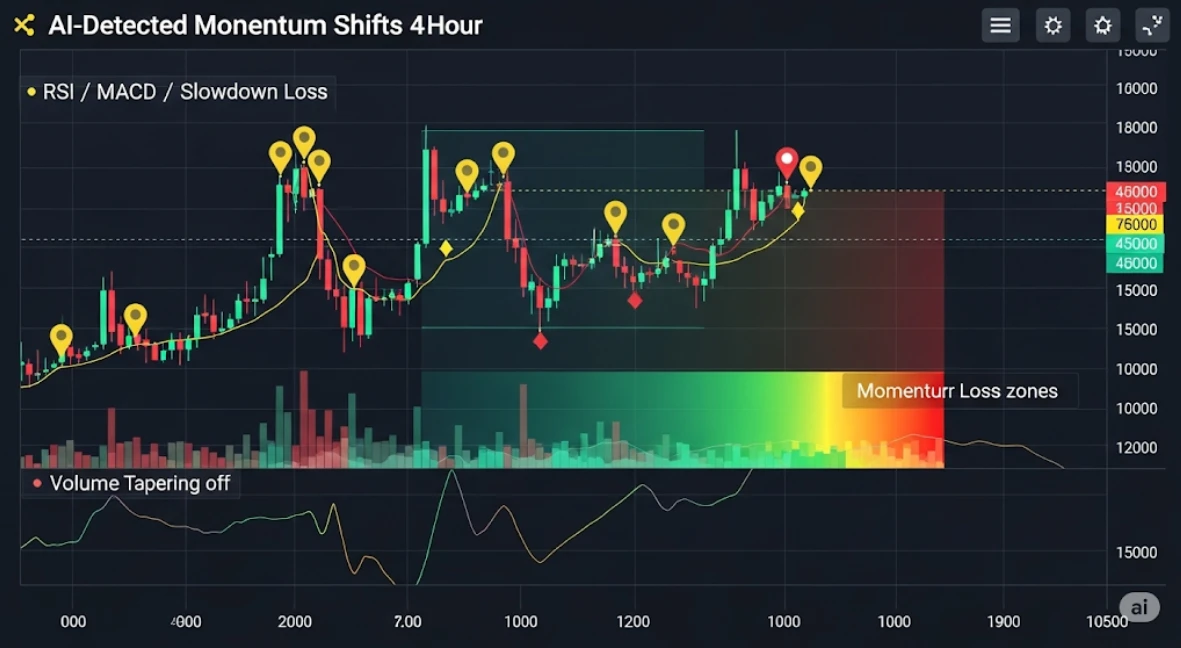
📊 Visual Example: AI Detects Momentum Shift Before Breakdown
Chart: BTC/USD on 4H timeframe
Price makes higher highs
RSI starts making lower highs
MACD histogram shrinks
Volume starts fading
AI marks “momentum shift” with a yellow arrow
Result: BTC breaks trendline and drops 8%
➡️ AI gave a visual warning 12 candles before the drop
📈 Top Indicators Where AI Adds Momentum Context
| Indicator | AI Enhancement |
|---|---|
| RSI | Detects hidden divergence, momentum flattening |
| MACD | Highlights weak crossovers, dead zones |
| OBV | Flags when volume is not confirming price |
| ROC | Tracks early signs of slowing momentum |
| VWAP | AI shows price strength relative to volume trend |
🧠 How to Trade AI Momentum Shift Signals
✅ Entry:
Watch for AI alert after consolidation or flag
Confirm with breakout volume
Align with macro trend or news if possible
✅ Exit:
AI alerts on volume fade or divergence
Trailing stop-loss once momentum flattens
Use AI “take-profit zones” if available
✅ Avoid:
Trading in chop—AI may detect false shifts in low-volume conditions
Over-relying on one timeframe—momentum is multi-dimensional
🔗 Related Reads You Might Like:


Pingback: Using AI to find strong stocks in weak markets. - Trade Pluse Ai