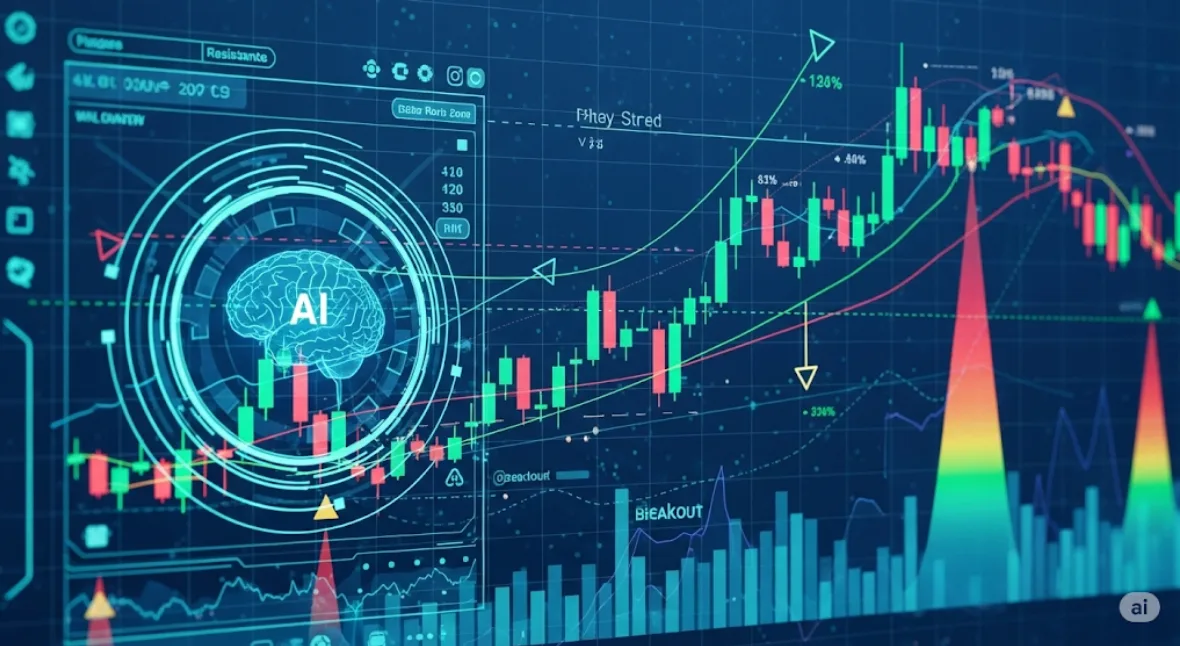
In the fast-evolving world of trading, one element remains consistent: chart levels. Support, resistance, supply-demand zones—these are the foundation of most price action strategies. But manually identifying them can be subjective and time-consuming. That’s where artificial intelligence steps in.
In this guide, we’ll explore how AI highlights important chart levels, the logic behind it, and how you can use this insight to improve your trades.

📊 What Are Important Chart Levels?
Before diving into AI’s role, let’s clarify the types of important chart levels:
Support & Resistance (S/R)
Support: Where price tends to bounce up
Resistance: Where price tends to get rejected
Supply & Demand Zones
Broad zones where institutional orders cluster
Psychological Levels
Round numbers (e.g., 1.2000, 20000, 100)
Trendlines & Channels
Diagonal support/resistance
Volume-Based Levels
Price areas with high volume (Volume Profile)
🧠 How AI Highlights Important Chart Levels
AI doesn’t just guess levels. It uses data-driven logic and pattern recognition across vast timeframes and instruments. Here’s how it works:
🔹 1. Price Action Clustering
AI identifies levels where price has:
Rejected or bounced multiple times
Consolidated before breakouts
Created long wicks (e.g., pin bars)
Example:
A price level tested 5 times in the past 6 months is tagged as “important”.
🔹 2. Volume Profile Analysis
AI uses Volume at Price to find:
High-volume nodes = support/resistance
Low-volume gaps = breakout zones
It scans these across multiple timeframes for confluence.
🔹 3. Machine Learning with Historical Data
Trained on years of chart data, AI models (like CNNs and LSTMs) learn:
Where major reversals occurred
Where false breakouts failed
How big players enter/exit markets
The model develops a probabilistic map of important zones.
🔹 4. Order Book Heatmaps
Advanced AI reads live order book data to detect:
Liquidity clusters
Spoof orders
Potential bounce zones
This provides real-time, dynamic levels based on market depth.
🔹 5. Pattern Recognition
AI instantly detects:
Double tops/bottoms
Head & shoulders
Breakout traps
Pin bars / engulfing candles
It then marks key levels where these patterns consistently appear.
📈 Visual Example: How AI Draws Chart Levels
Imagine a EUR/USD chart. AI processes:
Daily candles: finds 3 past rejections at 1.0950
Volume: sees high activity around 1.0950
4H pattern: detects bullish engulfing above 1.0950
➡ AI highlights 1.0950 as a strong support zone.
🧰 Best Tools That Use AI to Highlight Chart Levels
Here are top platforms and tools where AI does the heavy lifting:
| Tool | Key Features | Free? |
|---|---|---|
| TradingView + AI Scripts | Auto S/R, smart zones, multi-TF alignment | ✅ |
| TrendSpider | Dynamic S/R zones, Raindrop charts | ❌ (trial only) |
| AutoChartist | Pattern & level detection | ✅ (via brokers) |
| MetaTrader + AI Indicators | Custom AI-based level scripts | ✅ |
| FinRL (Python) | Deep learning to detect levels based on price action history | ✅ |
⚙️ How to Train Your Own AI to Find Key Levels
If you want to go deeper, here’s a brief guide:
✅ Step 1: Collect Historical OHLCV Data
Use APIs like Alpha Vantage or Binance
Ensure the data is cleaned and properly formatted
✅ Step 2: Define Key Level Criteria
Number of rejections
Wick size
Volume threshold
Breakout success rate
✅ Step 3: Train a Machine Learning Model
CNN for image-style pattern reading
LSTM or Transformer for sequential price data
Label support/resistance areas manually or semi-manually
✅ Step 4: Evaluate & Backtest
Use unseen data
Compare AI-generated levels vs. human-drawn levels
Measure success rate and bounce/reversal frequency
⚖️ AI vs. Human in Highlighting Chart Levels
| Criteria | Human | AI |
|---|---|---|
| Speed | Slow | Instant |
| Objectivity | Biased | Data-driven |
| Multi-timeframe analysis | Manual | Automatic |
| Emotional interference | High | None |
| Scalability | Low | High |
🔥 How AI Chart Levels Help in Real Trades
💡 Scenario 1: Intraday Forex
AI marks 1.2050 as intraday resistance based on 15M rejections and 4H supply.
Trader sets a short order below that level → Price reverses = Profitable trade.
💡 Scenario 2: Crypto Swing
AI spots support at $58,500 for BTC from daily trendline and order book depth.
Price dips, bounces → AI triggers alert → Buy trade with 3R potential.
💡 Scenario 3: Equity Breakout Trap
AI notes a false breakout above $160 with declining volume.
Recommends avoiding long trade → Saves from fakeout loss.
✅ Benefits of Using AI for Chart Level Detection
🚀 Speed & Automation – No more manual drawing
🎯 Accuracy – Backed by real data and testing
🔍 Multi-Timeframe Intelligence – Combines daily, hourly, minute levels
📉 False Breakout Filtering – Avoids weak or manipulated zones
🧠 Consistent Logic – No mood swings, no distractions
⚠️ Risks and Challenges
| Challenge | Solution |
|---|---|
| Overfitting to past data | Use live data validation |
| Ignoring market sentiment | Combine with news/sentiment AI |
| Blind trust in AI zones | Confirm with confluence (price action, volume, etc.) |
🧠 Pro Tip: Combine AI Levels with Manual Strategy
Let AI do the heavy lifting. Then:
Confirm with candlestick patterns
Add price action confirmation
Use risk management around those AI levels
It’s about synergy—not blind trust.
🌐 Future of AI in Chart Level Detection
Expect to see:
AI models adapting live to market volatility
Self-learning algorithms updating zones hourly
AI suggesting trade plans directly off levels
Integration with NLP (news sentiment + chart zones)
AI won’t just highlight chart levels—it will react to them in real-time.
🔍 FAQs
❓ Can I fully automate chart level detection?
Yes, many AI tools do this. But combining it with human review often improves performance.
❓ Does AI work in all markets?
Yes. Stocks, forex, crypto, indices—if there’s price data, AI can analyze it.
❓ Is AI good at catching fakeouts?
Advanced models can detect patterns of false breakouts based on volume and historical behavior.
🔗 Related Reads You Might Like:


Pingback: The Role of AI in Identifying Gaps and Gap Fills: A Smarter Way to Trade - Trade Pluse Ai