Introduction: Why AI for Candlestick Reversal Patterns is a Game-Changer
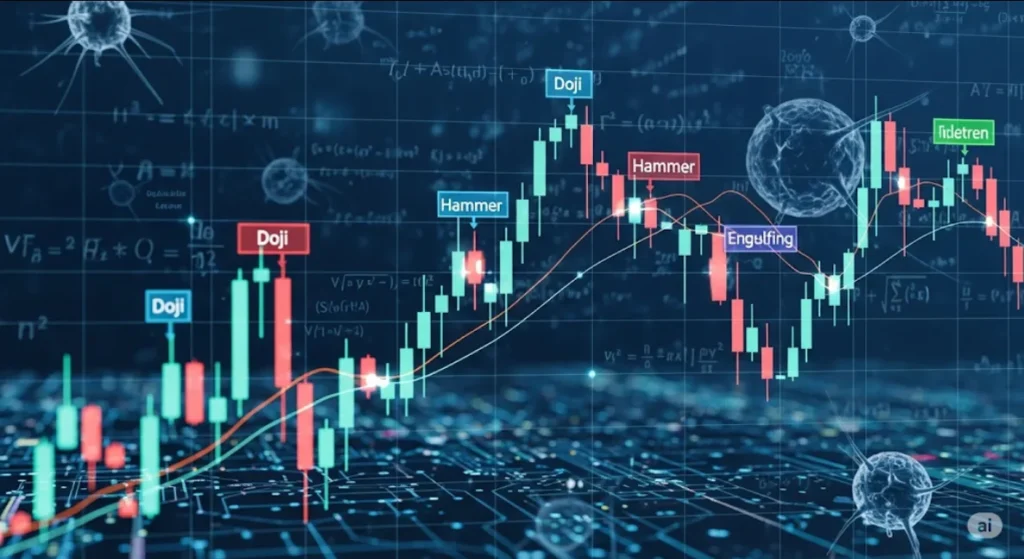
Candlestick patterns have guided traders for decades, signaling potential market reversals with formations like the Doji, Hammer, and Engulfing candles. But spotting these patterns manually requires keen observation—and human bias often creeps in.
Enter AI Detects Candlestick Reversal Patterns, a powerful tool that automates pattern recognition using machine learning, computer vision, and historical data analysis.
In this article, you’ll learn:
✅ How AI detects Doji, Hammer, and Engulfing patterns
✅ Best free tools using AI for candlestick reversal detection
✅ Real-world examples with AI pattern identification
✅ Tips to combine AI with your trading strategy
Let’s unlock the power of AI-driven candlestick analysis! 🚀
Understanding Candlestick Reversal Patterns
Before diving into AI, let’s quickly revisit these essential patterns:
🟡 Doji Pattern
Candle with almost equal open and close price
Indicates market indecision
Often appears before reversals
🟢 Hammer Pattern (Bullish Reversal)
Small real body near the top
Long lower shadow
Signals potential bullish reversal after downtrend
🔴 Engulfing Pattern
Large candle completely engulfs the previous candle
Bullish Engulfing: Down candle followed by strong up candle
Bearish Engulfing: Up candle followed by strong down candle
Spotting these patterns in real-time can reveal powerful reversal signals—but AI takes this to another level.
How AI Detects Candlestick Reversal Patterns
AI for candlestick reversal patterns uses algorithms to scan thousands of price bars, rapidly identifying key formations. Here’s how:
1️⃣ Data Analysis
AI analyzes price, open, high, low, and close (OHLC) data across multiple timeframes.
2️⃣ Pattern Recognition Algorithms
Computer vision models or rule-based AI recognize shapes matching:
✔️ Doji structures
✔️ Hammer candles with long wicks
✔️ Engulfing bodies relative to previous candles
3️⃣ Contextual Filtering
Sophisticated AI evaluates market context:
Trend direction before the pattern
Volume spikes
Confluence with support/resistance levels
This approach filters out weak or false signals, enhancing pattern accuracy.
Top Free Tools Using AI for Candlestick Reversal Patterns
Curious where to try AI-powered candlestick analysis? Here are top tools:
🛠️ 1. TradingView (Free Plan Available)
AI-enhanced pattern detection
Highlights Doji, Hammer, Engulfing candles
Custom alerts for pattern occurrences
🛠️ 2. Finviz (Basic Free Access)
Automated chart pattern recognition
Spot reversal signals on price charts
Upgrade unlocks advanced AI filtering
🛠️ 3. TrendSpider (Trial with AI Features)
🌐 TrendSpider Automated Charts
AI-detected candlestick patterns in real-time
Multi-timeframe confirmation
Backtesting reversal pattern setups
Note: Some features may require trials or premium access, but basic AI pattern detection is available for free on many platforms.
Real-World Example: AI Detecting Reversal Patterns
Imagine analyzing Apple (AAPL) stock on TradingView:
✅ AI marks a Doji candle at key resistance
✅ A few bars later, a Bearish Engulfing forms, confirmed by AI
✅ Volume spike and RSI divergence strengthen reversal case
This multi-layer AI analysis empowers traders to act decisively.
Why Use AI for Candlestick Reversal Patterns?
Here’s how AI gives traders an edge:
✔️ Speed: Instantly scans charts for reversal setups
✔️ Accuracy: Reduces subjective interpretation
✔️ Coverage: Monitors multiple assets and timeframes
✔️ Backtesting: Tests reversal strategies with historical data
✔️ Alerts: Get notified when AI detects Doji, Hammer, or Engulfing
AI simplifies technical analysis, especially for beginners learning chart patterns.
Combining AI-Detected Reversal Patterns with Other Indicators
Boost your success by pairing AI for candlestick reversal patterns with:
✅ Moving Averages: Confirm trend direction
✅ Volume Analysis: Validate breakout strength
✅ RSI/MACD: Spot momentum shifts
✅ Support/Resistance Zones: Identify high-probability reversal areas
This multi-signal approach improves reliability and filters out false positives.
Pro Tips for Using AI for Candlestick Reversal Patterns
💡 Focus on patterns near key support/resistance levels
💡 Combine with trend indicators for confirmation
💡 Backtest reversal setups to understand win rates
💡 Use AI alerts but verify patterns visually
💡 Monitor multiple timeframes for stronger signals
Common Mistakes to Avoid
⚠️ Relying solely on one candlestick pattern
⚠️ Ignoring market context (trend, volume)
⚠️ Overtrading based on weak reversal signals
⚠️ Not combining AI insights with risk management
Remember: AI enhances, but doesn’t replace, sound trading discipline.
AI for Candlestick Reversal Patterns vs. Manual Detection
| Feature | Manual Detection | AI-Driven Detection |
|---|---|---|
| Speed | Slower, visual scan | Instant, multi-chart scanning |
| Accuracy | Subjective, error-prone | Data-driven precision |
| Multi-timeframe Analysis | Requires switching charts | AI handles simultaneously |
| Alerts | Manual monitoring | Real-time AI alerts |
| Learning Curve | High for beginners | Beginner-friendly automation |
Final Thoughts: AI for Candlestick Reversal Patterns is the Future
Whether you’re day trading, swing trading, or investing long-term, AI for candlestick reversal patterns helps:
✅ Spot Doji, Hammer, and Engulfing signals fast
✅ Reduce human bias in pattern interpretation
✅ Improve technical analysis confidence
✅ Act swiftly on reversal opportunities
🔗 Related Reads You Might Like:


Pingback: Inside Bar Trading with AI: Simplified Strategy for Smarter Market Entries - Trade Pluse Ai