AI-Powered Support & Resistance Zones: Smarter Charting Beyond Simple Lines
In technical analysis, few tools are more fundamental than support and resistance. Traditionally, these are drawn as static horizontal lines at key price levels—but the market doesn’t move in straight lines. It fluctuates, fakes out, and tests zones repeatedly.
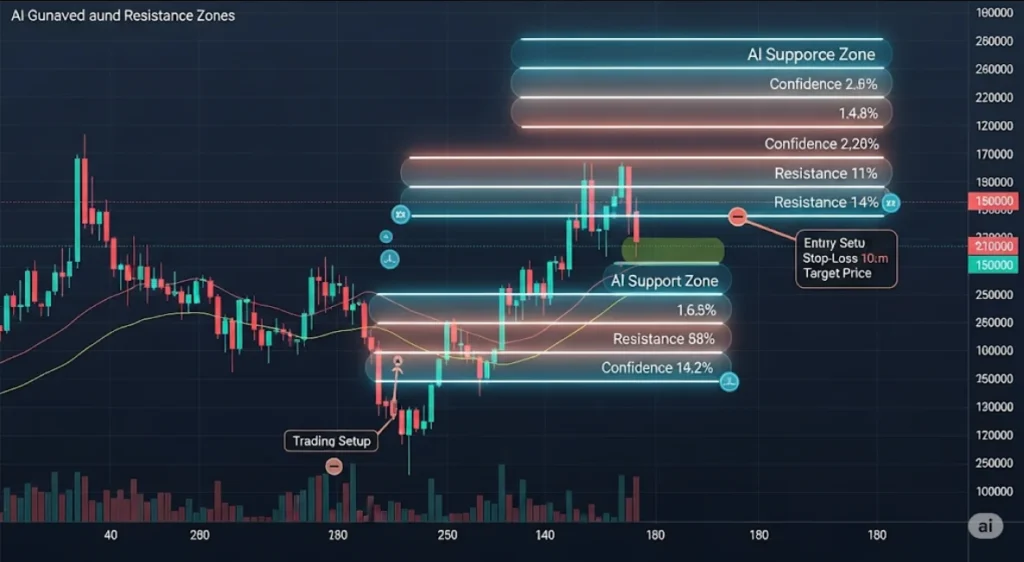
That’s why AI-powered support and resistance zones are revolutionizing how traders chart, analyze, and trade price action.
In this article, we explore how AI finds dynamic support/resistance zones, why zones outperform lines, and the best tools you can use—100% free.

🧱 What Are Support & Resistance Zones?
Support Zone: A price area where buying interest historically prevents further price decline.
Resistance Zone: A price area where selling pressure stalls upward movement.
Unlike precise lines, zones are ranges—think of them as “price gravity fields” where action consolidates or reverses.
🧭 Why Zones > Lines?
| Static Lines | AI-Powered Zones |
|---|---|
| Exact price points | Adaptive price ranges |
| Prone to fakeouts | Account for market noise |
| Manual drawing | Automatically detected |
| Lack of confidence area | Includes volume and price clusters |
| Timeframe-specific | Multi-timeframe integration |
🤖 Why Use AI for Support & Resistance?
Traditional support/resistance levels are often:
Subjective
Lagging
Inflexible across timeframes
AI changes the game by using real data—price clusters, volume distributions, volatility, and historical reaction points—to automatically map out zones that actually influence price action.
✅ Benefits of AI-Powered Zones:
📊 Data-Driven Accuracy: No guesswork. Just machine-learned logic.
🔁 Dynamic Adjustments: Zones adapt as the market changes
📈 Volume-Weighted Logic: Focuses on price levels with actual traded activity
⏱ Multi-Timeframe Integration: Identifies zones across 1H, 4H, daily, weekly
🔔 Real-Time Alerts: When price approaches a high-probability zone
🔍 How AI Detects Support & Resistance Zones
1️⃣ Historical Price Behavior
AI scans historical candles to find:
Price bounces
Rejection wicks
Reversal points
It clusters these together to create zones based on recurrence.
2️⃣ Volume Profile Analysis
Uses volume-at-price metrics
Detects high liquidity and high-volume nodes (HVNs)
These areas are natural support/resistance zones
3️⃣ Order Flow & Heatmaps
AI integrates order book data or heatmaps
Identifies where traders are placing stop orders, limit buys/sells
Builds dynamic “pressure zones”
4️⃣ Volatility & Trend Context
AI adjusts zones based on ATR or Bollinger Band width
Wide zones in high-volatility markets
Narrow zones in low-volatility conditions
5️⃣ Scoring System
Each zone gets a confidence score, factoring:
Frequency of bounces
Time spent near the zone
Volume traded
Confluence with technical levels (moving averages, fib retracements)
🧰 Best Free Tools for AI-Powered Zones
✅ 1. TradingView (AI Scripts & Indicators)
Best For: Visual charting with overlays
Public scripts like “Smart Support & Resistance Zones” use AI-style logic
Auto-plots zones based on multi-timeframe confluence + price clusters
Sends alerts when price nears a zone
🔹 Free Plan: Use custom community scripts without coding
✅ 2. TrendSpider
Best For: Fully automated zone detection
AI automatically detects zones using price behavior + volume profile
Dynamic zones adjust in real-time
Can backtest zone reaction probability
🔹 Free Trial: All premium zone features available for 7 days
✅ 3. Finviz (Free Screener + Chart Levels)
Best For: Fundamental + technical fusion
Detects recent price levels where stocks reacted
AI scores S/R strength based on recency + reaction quality
Ideal for swing traders
🔹 Free Tier: Access charts and zone-level technical snapshots
✅ 4. MetaTrader 5 + Smart Indicators
Best For: Automated zone-based trading
Free indicators like “S/R Auto Zones” detect key levels
Many EAs integrate zone-based logic for entries/exits
AI logic often based on fractals, volume, and pivots
🔹 Free: Huge community of MT5 AI-based zone detectors
✅ 5. QuantConnect (for advanced users)
Best For: Custom AI development
Coders can create AI models to define zones
Combines volume, price patterns, Fibonacci levels
Backtest zone performance across markets
🔹 Free Plan: Build & test strategies in Python
🧠 How to Trade Using AI-Powered Support & Resistance Zones
🔹 Step 1: Identify High-Probability Zones
Use an AI tool to display zones. Focus on those with:
High volume concentration
Multiple historical bounces
Clear confluence with trend indicators
🔹 Step 2: Set Trade Triggers
Once price enters a zone:
Look for candlestick confirmation (pin bars, engulfing)
Use volume surge as added confirmation
Avoid immediate entries — wait for structure
🔹 Step 3: Entry Strategy
Buy near support zones with reversal confirmation
Sell near resistance zones with exhaustion signs
For breakouts, wait for close beyond the zone + volume confirmation
🔹 Step 4: Place Stops & Targets
Stop-loss: Outside the opposite edge of the zone
Take-profit: Next major zone or fixed R:R (e.g., 2:1)
🔹 Step 5: Use Alerts and Backtesting
Set AI alerts when price nears or breaks zones
Backtest zone reliability over the last 3–6 months
🧠 Real-World Example: Apple (AAPL)
AI identifies a support zone between $172–$174:
4 historical bounces
High volume cluster
Near 50-day moving average
You wait for:
Price to dip into the zone
Bullish engulfing candle
RSI bounce from oversold
🟢 Trade: Long position at $173
🔻 Stop: $171
🎯 Target: Resistance zone at $179
📈 Outcome: 3R win
AI confirmed the zone—and you executed with confidence.
🔗 Related Reads You Might Like:
