
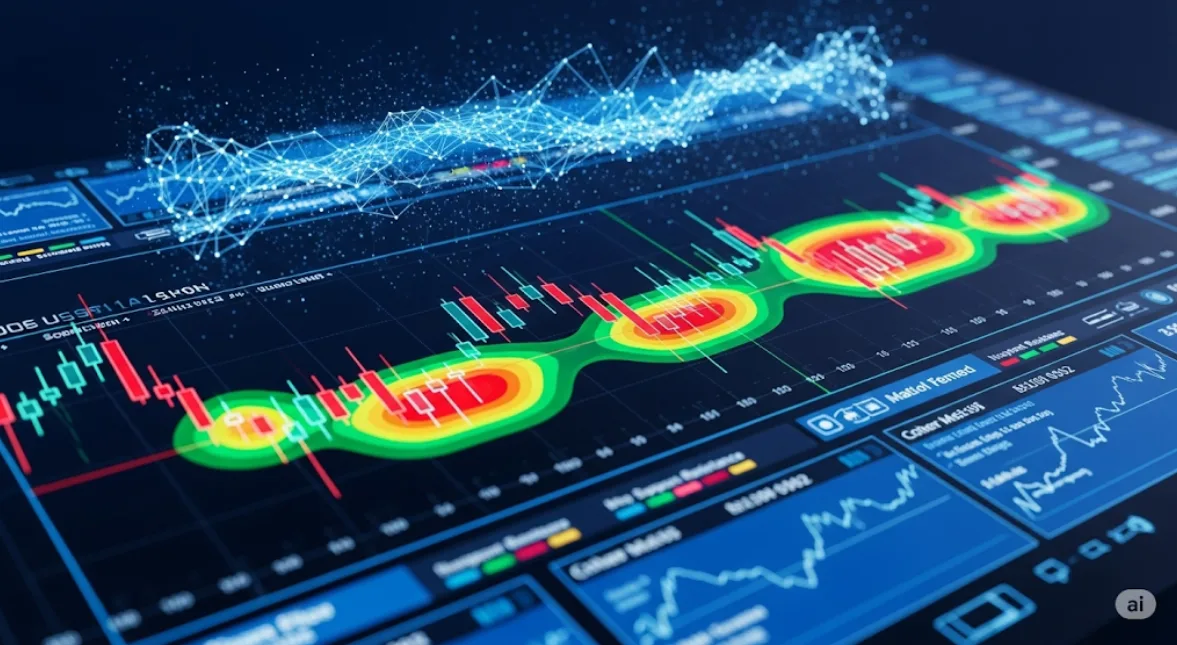
Understanding AI-Generated Heatmaps in Charting Tools: A Trader’s Visual Edge
In today’s fast-paced trading environment, data overload is a real challenge. Price, volume, volatility, order flow—it’s too much to absorb in real-time. Traders, especially retail investors, need smarter, faster, and more intuitive tools.
Enter: AI-generated heatmaps in charting tools.
These visual overlays transform raw data into intuitive, color-coded zones of interest—revealing where markets are likely to react, reverse, or accelerate. In this article, we’ll break down how heatmaps work, how AI enhances them, and why they’re revolutionizing technical analysis.
🔍 What Are Heatmaps in Trading?
A heatmap in trading is a visual representation of data intensity. It uses color gradients (e.g., red to green or blue to yellow) to show the strength or frequency of market behaviors—like:
Buy/sell orders
Price-volume relationships
Support/resistance levels
Volatility or liquidity zones
Heatmaps simplify complex data into a format that’s instantly readable, allowing traders to:
Spot high-activity areas
Visualize market sentiment
Avoid decision paralysis
🧠 What Are AI-Generated Heatmaps?
AI-generated heatmaps go beyond static indicators. They use machine learning algorithms to analyze massive volumes of historical and real-time data, detecting patterns the human eye can’t see.
Instead of just plotting “where traders placed orders,” AI models highlight zones with high statistical probability of market reactions based on:
Historical support/resistance behavior
Volume clusters
Momentum shifts
Breakout/reversal tendencies
Institutional activity footprints
✅ Benefits of AI Over Manual Heatmaps:
| Feature | Manual Heatmap | AI-Generated Heatmap |
|---|---|---|
| Based on | Recent data only | Entire market history |
| Bias | Prone to subjectivity | Data-driven |
| Updates | Static or delayed | Real-time |
| Accuracy | Limited to user logic | Learns & improves over time |
🎨 How AI-Generated Heatmaps Are Built
Let’s break down the process in a simplified, step-by-step manner:
🔸 1. Data Collection
AI systems pull historical and live market data:
OHLCV (Open, High, Low, Close, Volume)
Bid/ask depth
Tick data
Order flow and time & sales
News and events (optional)
🔸 2. Feature Extraction
AI scans for key behaviors like:
Repeated bounce/rejection zones
Price congestion points
High-volume candles
Failed breakouts
Volume/price divergence
🔸 3. Clustering and Pattern Recognition
Using models like:
K-means Clustering
Autoencoders
CNNs (for image-based data)
DBSCAN (density-based models)
AI identifies zones with shared behavior, such as:
“Price bounced here 78% of the time”
“This range absorbed 85% of volume during volatility spikes”
🔸 4. Heatmap Rendering
Color is applied based on:
Frequency of activity
Historical reaction strength
Recent confirmations
Machine confidence score
The result: intelligent heatmaps that show zones like support/resistance with adaptive precision.
🧪 Use Cases of AI-Generated Heatmaps in Charting Tools
📈 1. Support and Resistance Detection
Instead of drawing horizontal lines, AI heatmaps highlight zones, not just levels. These zones shift based on volume behavior, not price alone.
Example:
A red band between $102.50 and $103.20 tells traders: “This zone historically attracts sellers.”
⚡ 2. Volume Profile and Order Imbalance
Heatmaps show where volume accumulated disproportionately—great for spotting smart money accumulation or distribution.
Blue = low activity
Yellow = moderate
Red = high accumulation
🧭 3. Breakout/Breakdown Zones
AI identifies and highlights compression zones that often precede sharp moves. If the price revisits that zone, a heatmap alert is generated.
Useful in swing trading and breakout scalping
🧱 4. Liquidity Mapping
Especially useful in futures and crypto, where market depth matters. AI shows where liquidity “sits,” helping avoid slippage or getting trapped.
Helps traders route entries/exits with low impact
🛠️ Best AI Tools for Heatmap Charting (Free & Paid)
| Tool | Features | AI Heatmaps? | Free Plan? |
|---|---|---|---|
| TradingLite | Real-time heatmaps of BTC order book | ✅ | ❌ (trial only) |
| Bookmap | Heatmap of market liquidity with AI overlays | ✅ | ✅ (basic) |
| TrendSpider | AI-generated support/resistance zones | ✅ | ✅ |
| QuantConnect | Build AI heatmaps with Python | ✅ | ✅ |
| ThinkorSwim + Custom Scripts | Add heatmap logic via studies | Partial | ✅ |
⚖️ Human vs. AI Heatmap Interpretation
| Task | Human | AI |
|---|---|---|
| Draw support lines | Subjective | Statistically driven |
| Update zones in real-time | Slow | Instant |
| Recognize clustering | Limited | Optimized |
| Adapt to new patterns | Needs experience | Self-learning |
💡 How AI-Generated Heatmaps Help Small Traders
✅ 1. Visual Clarity
No more messy charts with 10 indicators. A heatmap gives clear, colorful zones of interest.
✅ 2. Quick Decision-Making
When price enters a red zone, the trader knows it’s high risk for reversal. Fast action = more confident trades.
✅ 3. Reduced Bias
AI doesn’t trade on emotion. Heatmaps generated from unbiased data guide traders away from impulsive decisions.
✅ 4. Scalability
Whether trading one stock or 50, AI heatmaps scale effortlessly across multiple charts and markets.
🎯 Example: Using AI Heatmaps in a Trade
Imagine a heatmap shows red resistance at $148–$150 in a stock. As price enters that zone with decreasing volume, you prepare for a short.
Why?
Historical rejections occurred here
AI marks zone as high-saturation area
Volume is not confirming breakout
You enter a short, stop-loss above zone, and price falls to $143. Your win was guided by AI’s visual cue—faster and clearer than waiting for confirmation indicators.
⚠️ Common Mistakes with Heatmaps
| Mistake | Fix |
|---|---|
| Relying only on color | Combine heatmaps with price action or volume |
| Ignoring context | Red zone ≠ always resistance. Look at news/events |
| Using outdated tools | Use AI-enhanced maps, not just visual overlays |
| No backtesting | Always test heatmap strategies before trading live |
🔮 The Future of AI in Heatmap Charting
Expect advancements like:
3D heatmaps (showing time, price, and volume simultaneously)
Voice-assisted heatmap alerts
Sentiment-enhanced zones (e.g., tweets/news aligned with chart zones)
Self-learning bots using heatmaps to auto-execute trades
🔗 Related Reads You Might Like:


Pingback: AI for Ichimoku Cloud: Simplified Interpretation for Smarter Trading - Trade Pluse Ai