AI for Long-Term Trend Identification on Charts: Smarter Investing Starts Here
Long-term trend investing can yield the biggest profits—but identifying these trends early and accurately is no easy task. Traditional tools like moving averages and trendlines help, but they often lag and rely on manual interpretation.
Now, thanks to AI for long-term trend identification, investors can detect trends earlier, reduce emotional bias, and make data-driven decisions with more confidence.
In this article, you’ll learn:
How AI detects long-term trends on charts
The best free AI tools to use
Indicators and strategies powered by AI
Real-world examples of trend detection
Why this matters for swing, position, and even retirement investing
📈 Why Long-Term Trend Identification Matters
Trends are the foundation of all price movement. Whether you’re trading stocks, crypto, commodities, or forex—riding a strong trend is how wealth is built.
But the challenge?
🔻 Identifying the beginning of a trend
⚠️ Avoiding false breakouts
📉 Exiting before the trend collapses
AI helps solve these problems through pattern recognition, volume analytics, and cross-timeframe analysis—all in real time.
🧠 How AI Identifies Long-Term Trends
Let’s break down what modern AI tools do under the hood when analyzing a chart for long-term trends.
🔍 1. Data Cleaning + Smoothing
AI removes market “noise” and focuses on:
High-probability price movement
Macro-level support/resistance
Volume-weighted trends
It uses machine learning to separate temporary pullbacks from structural reversals.
📊 2. Multi-Timeframe Analysis
AI scans daily, weekly, and monthly charts together, identifying:
Shared directional momentum
Consistency in volume across timeframes
Trend correlation with macroeconomic indicators
📐 3. Pattern Recognition
AI detects larger-scale formations:
Broadening wedges
Cup-and-handle
Long base breakouts
Multi-year trendlines
It also identifies trend acceleration zones based on slope changes.
🔁 4. Backtested Trend Strength Modeling
AI analyzes how similar trends behaved in the past, scoring:
Trend strength
Average hold time
Drawdown potential
Continuation probability
🧰 Best Free AI Tools for Long-Term Trend Identification
Looking for practical tools to apply today? Here are top platforms that offer AI-driven trend identification, even on a free plan:
✅ 1. TradingView + AI Scripts
Best for: Long-term technical trend overlays
Use Pine Script tools like “AI Trend Strength Indicator” or “Smart Trend Follower”
Automatically plots trend continuation or breakdown zones
Combines moving averages, volume, RSI, and trend slope for high-accuracy visuals
🔹 Free Tier: 1 chart, 3 indicators, full access to community scripts
✅ 2. Finbrain.tech (Free Insights)
Best for: Weekly trend forecasting based on AI models
Predicts weekly trend direction based on news sentiment + technical data
Great for swing traders or position investors
Sector-level trend forecasting
🔹 Free Plan: Limited tickers, weekly insights
✅ 3. TrendSpider (Trial Access)
Best for: Auto-trendlines + Raindrop chart insights
AI identifies long-term resistance/support on daily/weekly charts
“Trend Explorer” uses volume-weighted trend zones
Real-time alerts when long-term trends break or reverse
🔹 Free Trial: 7-day access to full AI toolset
✅ 4. Kavout Kai Score
Best for: Long-term investment ratings powered by AI
Uses fundamental + technical AI scoring
Great for spotting macro trends with AI momentum signals
Shows trend reliability based on historical consistency
🔹 Free Tier: Top trending tickers and limited KaiScore access
✅ 5. MetaTrader 5 (MT5) with AI Plugins
Best for: Custom AI indicators for trend trading
Use plugins like “AI Trend Scanner,” “Smart Slope,” or “ZigZag Deep Trend”
Allows daily/weekly chart analysis
Combines price, volume, and sentiment inputs
🔹 Free: Many AI tools available in the MT5 marketplace or forums
🔍 Top AI-Based Indicators for Long-Term Trends
| Indicator Name | What It Does | AI Upgrade |
|---|---|---|
| Moving Average Ribbon | Shows trend alignment across timeframes | AI adapts period lengths for trend shifts |
| MACD with Trend Filter | Reveals bullish/bearish crossover + histogram | AI filters noise and false signals |
| Volume-Weighted Trendline | Confirms direction based on commitment | AI smooths slope changes |
| Dynamic Support Zones | Detects long-term demand areas | AI updates zones in real time |
| SuperTrend AI | Combines ATR + AI for smarter trailing stop | Yes |
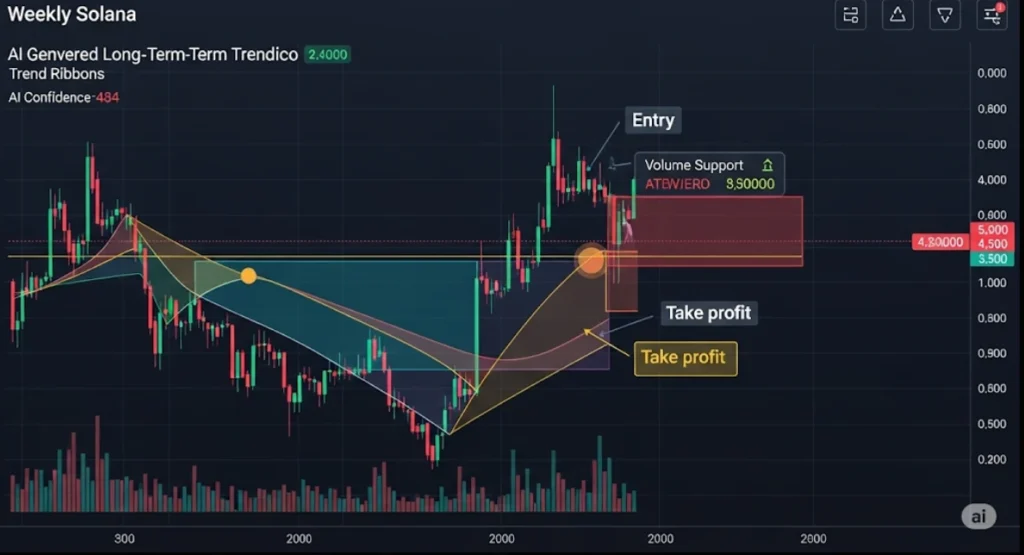
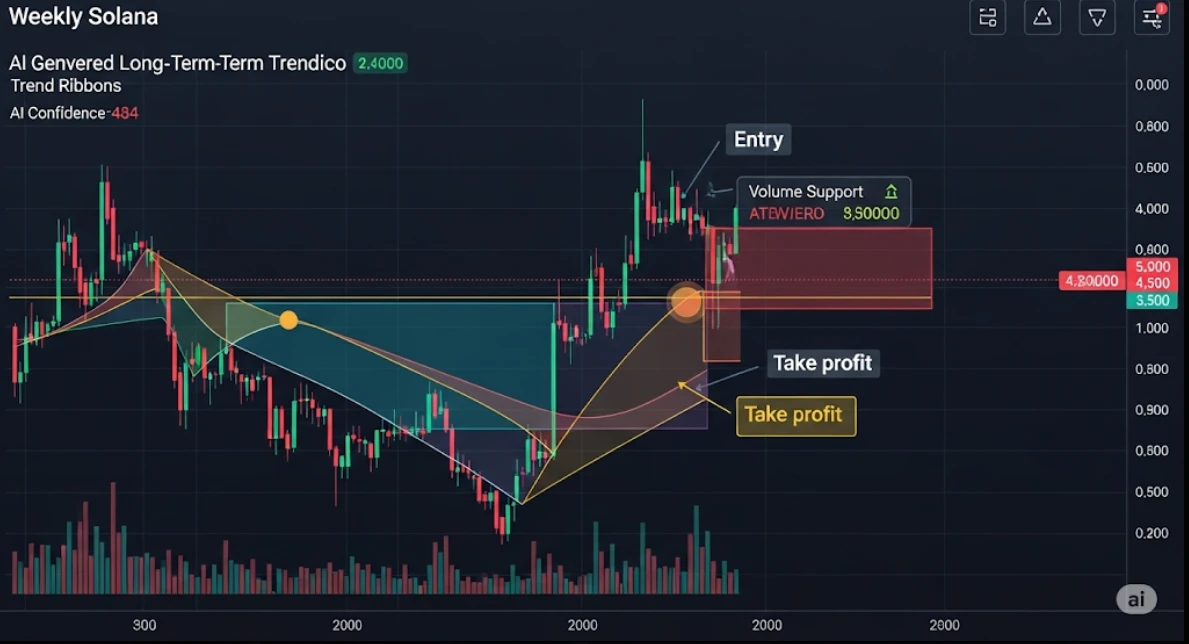
📈 Real-World Example: Long-Term AI Trend on AAPL
Chart: Weekly timeframe
AI trendline shows rising support from $120
Trend ribbon aligns (9, 20, 50 MAs all bullish)
Volume confirms every breakout zone
AI alerts when momentum weakens near $198 resistance
🟢 Result: Investor holds AAPL from $145 to $192 over 6 months
The AI didn’t just say “buy.” It confirmed:
Trend strength
Entry zone
When the trend lost momentum
📊 Long-Term Trend Setup Checklist (With AI)
✅ Weekly chart: Look for rising support trendline
✅ Trend ribbon: All EMAs aligned up
✅ MACD + RSI: No divergence
✅ Volume: Accumulation, not distribution
✅ AI tool says: High probability continuation
✅ Optional: Use Fibonacci or measured move targets
📌 Who Should Use AI for Long-Term Trend Detection?
This approach is ideal for:
🔹 Swing traders holding for days to weeks
🔹 Position traders holding 1–6 months
🔹 Investors looking for growth or dividend plays
🔹 Crypto holders timing market cycles
🔹 ETF buyers aiming for sector rotation plays
Whether you’re aiming for a 15% move or a multi-year hold—AI gives clarity.
🧠 Pro Tips: Long-Term Trend Trading with AI
💡 Avoid Choppy Charts
AI can help identify clean trends—but it can’t make a trend out of noise.
💡 Don’t Chase—Plan
Use AI alerts for pullback entries, not panic buying.
💡 Watch the Trend Slope
AI can track slope acceleration (trend is strengthening) or flattening (prepare to exit).
💡 Volume is King
Combine AI with On-Balance Volume or Accumulation/Distribution indicators.
🔗 Related Reads You Might Like:


Pingback: How AI Highlights Momentum Shifts in Trading Charts - Trade Pluse Ai