
AI-Driven Volume-Price Analysis (VPA) for Small Investors: Smarter Trades with Less Capital
The combination of volume and price action is a time-tested formula for smart trading. It helps traders understand the strength behind a move, identifying whether a price change is real—or just noise. But mastering Volume-Price Analysis (VPA) requires years of experience.
Now, AI-driven Volume-Price Analysis for small investors is leveling the playing field. By automating data processing and pattern recognition, artificial intelligence is giving small traders access to professional-grade tools.
In this guide, we explore how AI makes VPA accessible, affordable, and actionable—even if you’re starting with just a few hundred dollars.
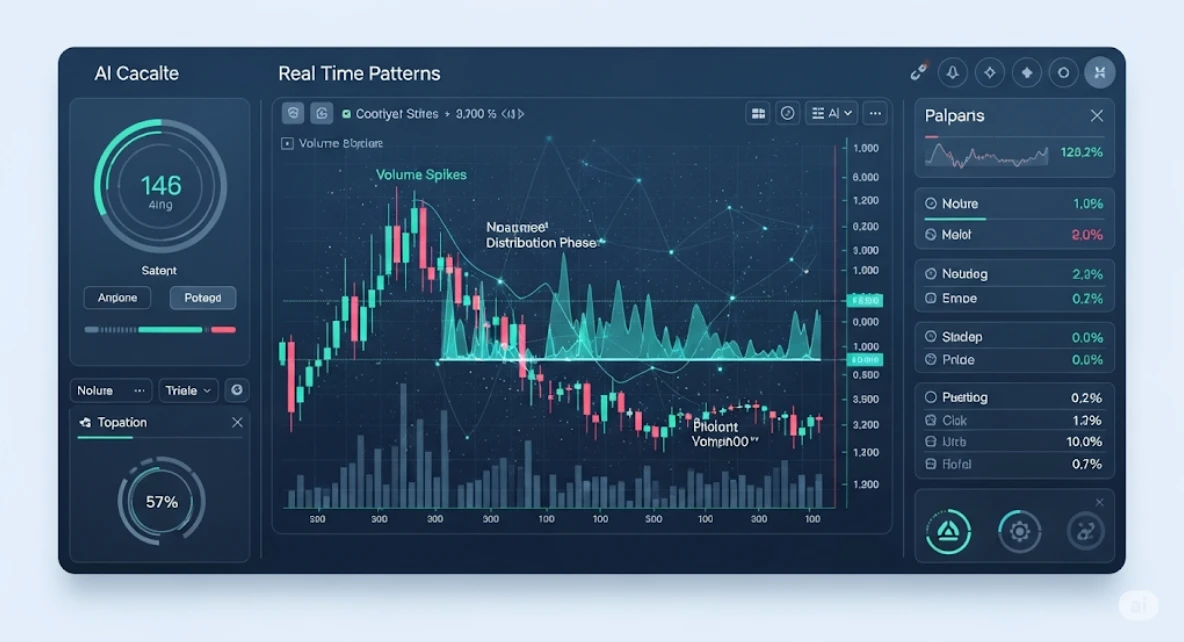
📊 What is Volume-Price Analysis (VPA)?
Volume-Price Analysis (VPA) is a technical trading method that evaluates the relationship between price movement and trading volume. The core principle is:
“Price movement without volume is weak. Volume confirms price direction.”
🔹 VPA Core Concepts:
High Volume + Rising Price = Strength, possible continuation
Low Volume + Rising Price = Weak move, possible reversal
High Volume + Falling Price = Panic selling or smart money exiting
Low Volume + Falling Price = Lack of interest, indecision
This method helps detect:
Breakouts
Traps
Exhaustion points
Smart money accumulation or distribution
But analyzing volume-price behavior manually is hard—especially in fast-moving markets. Enter AI.
🤖 How AI Improves Volume-Price Analysis for Small Investors
✅ 1. Pattern Recognition at Scale
AI can detect:
Volume spikes
Divergences
Accumulation/distribution zones
Reversal volumes
Instead of eyeballing charts, AI analyzes thousands of price-volume patterns and learns what typically follows.
✅ 2. Contextual Volume Reading
AI models can understand the context:
Is the volume spike after a breakout or before earnings?
Is the low volume during a range or near resistance?
This context-driven approach mimics what expert traders do—only faster and more accurately.
✅ 3. Predictive Modeling
By using machine learning (e.g., Random Forests, LSTM networks), AI models can:
Forecast the probability of a breakout
Predict exhaustion zones
Identify volume-supported reversal signals
This helps small investors make more informed, lower-risk decisions.
🛠️ AI VPA Tools for Small Investors
Here are some of the best free or low-cost AI tools for VPA that are ideal for beginners and small accounts:
| Tool | Key Features | Free? |
|---|---|---|
| TradingView + AI Volume Indicators | Custom Pine Script indicators for VPA | ✅ |
| Finviz Elite (Volume Heatmaps) | Visual screening of volume surges | ❌ (low cost) |
| AutoChartist | AI-based volume and price pattern scanner | ✅ via brokers |
| MetaTrader + AI Indicators | Custom volume AI scripts in MQL4/5 | ✅ |
| ChatGPT + Python API (Pandas + Scikit-Learn) | Build custom AI VPA models | ✅ |
🧠 How AI-Driven VPA Works Step-by-Step
🔍 Step 1: Collect Data
AI models ingest:
OHLCV (Open, High, Low, Close, Volume) data
Historical events (earnings, news)
Technical levels (support, resistance)
🔍 Step 2: Feature Engineering
AI builds new data points like:
Volume Moving Averages
Price-Volume Divergence
Volume Spikes vs. Baseline
Relative Volume Indicators (RVI)
🔍 Step 3: Train Predictive Model
Models like XGBoost, Random Forest, or Neural Networks are trained on historical chart patterns labeled as:
“Breakout success”
“False breakout”
“Reversal zone”
These patterns include volume/price behaviors
🔍 Step 4: Generate Trading Signals
The model outputs:
Probability of breakout
Signal confidence score
Entry/exit suggestions based on volume confirmation
💡 Example: AI VPA in a Small-Cap Stock
Let’s say you’re watching XYZ, a low-float stock priced at $3.50. AI-driven VPA:
Detects volume spike 5x average with price breaking past $3.60
Confirms the move by comparing to 50+ similar historical patterns
Sends a buy alert: 72% probability of follow-through
With $300, you take a small position. Price hits $4.10 in 30 minutes. You secure 15% profit based on smart VPA and zero guesswork.
📈 Popular AI VPA Signals Small Investors Should Know
| Signal | What It Means | AI Interpretation |
|---|---|---|
| Climactic Volume Bar | End of a move | Probable reversal zone |
| Low Volume Pullback | Weak selling | Continuation likely |
| High Volume Breakout | Strong conviction | Valid breakout |
| Volume Divergence | Price up, volume down | Bearish warning |
| Trap Volume | Volume spike + reversal candle | Fake move warning |
⚖️ Human vs. AI in Volume-Price Analysis
| Feature | Human Trader | AI Trader |
|---|---|---|
| Volume Reading | Based on gut/experience | Data-driven |
| Speed | Slow, subjective | Instant |
| Emotion | Prone to bias | None |
| Scalability | One chart at a time | 1,000s simultaneously |
| Learning Curve | High | Low (pre-built or code-based) |
📉 Why Small Investors Should Use AI VPA
🔸 1. Low Capital, High Precision
When you have limited funds, precision matters more than frequency. AI-VPA helps filter high-confidence setups with strong volume confirmation.
🔸 2. Time-Saving
Most small investors trade part-time. AI tools alert you when a valid VPA signal occurs—no need to stare at charts for hours.
🔸 3. Risk Management
AI-driven VPA flags traps and fakeouts early. This helps avoid common retail mistakes like:
Chasing breakouts without volume
Buying into distribution phases
🧪 AI-Powered VPA Strategy for Small Traders
Strategy: Breakout Confirmation with AI-VPA
Filter stocks with volume > 200% average
Confirm price breaks above resistance
Use AI model to check:
Volume pattern matches historical breakouts
Confidence score > 70%
Entry = breakout candle close
Stop = below support
Target = 2:1 risk-reward
Test this on 100+ setups with backtesting. You’ll see how AI-VPA improves the odds.
🔗 Related Reads You Might Like:


Pingback: Understanding AI-Generated Heatmaps in Charting Tools: A Trader's Visual Edge - Trade Pluse Ai