🧠 The Real Reason Candlestick Chart Colors Matter
Okay, let’s be real for a second: candlestick charts are basically the heartbeat of technical analysis. Quick glance and, bam—open, high, low, close, and you’re already reading the market’s mood like a psychic at a carnival. Bullish, bearish, the whole drama.
But here’s the kicker: the color of those candles? That’s the real tea. If you know how to decode it, you’re halfway to reading the market’s mind.
Now picture this—AI sliding in, helping you read those color cues like it’s cheating on a quiz. No more guessing or staring at red and green blobs until your eyes cross.
Welcome to the future. AI-powered color analysis for candlesticks. It’s wild.

🔎 So, What’s This “Candlestick Color Analysis” Anyway?
Alright, break it down—
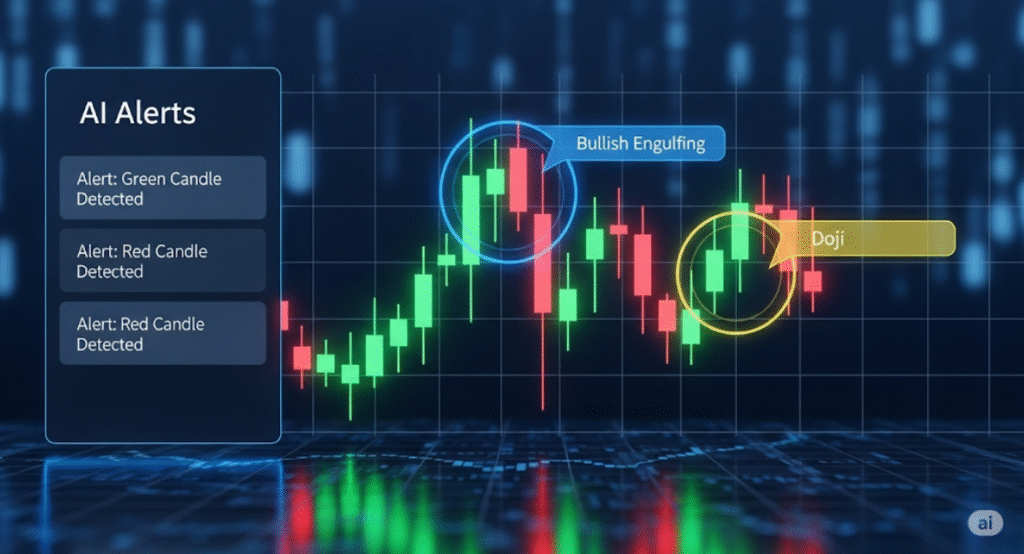
✅ Green candle? Price closed higher than it opened (bulls are partying).
❌ Red candle? Price closed lower (bears are growling).
😐 Neutral or grey-ish? Meh, not much action.
But, wait, there’s more. Pros don’t just look at single candles. They’re tracking streaks (like, five greens in a row), sudden color flips, and how those colors play inside wild patterns—engulfing, dojis, hammers, all the weird shapes.
It’s like mood rings for stocks. You just gotta know what the color mood means.
🤖 How AI Levels Up the Color Game
AI isn’t just looking at “red good, green bad.” Nah—it’s way deeper. Here’s the cool stuff AI does:
Pattern Hawk: Sniffs out bullish and bearish color combos
Streak Sniper: Finds crazy runs (seven green candles in a row? Something’s up)
Reversal Radar: Spots when color flips tip off a market U-turn
Volume Sidekick: Checks if a color move is actually backed up by serious trading
Sentiment Sleuth: Reads the crowd’s mood through color streaks
Multi-Timeframe Wizardry: Confirms stuff across daily, 4H, 1H—no more getting faked out
📈 Real-World Example: AI’s Got Your Back
Say you’re eyeing Apple (AAPL). Here’s what you see:
Four angry red candles—ouch.
Then bam, a green doji (that’s like a market “maybe?”)
Volume suddenly spikes.
If you’ve got an AI tool on watch, it might ping you:
“⚠️ Reversal brewing: Red streak fading, bullish doji with strong volume.”
Translation? Get ready, something’s about to pop.
🧰 Free AI Tools for Candlestick Color Analysis
(Because Who Doesn’t Love Free Stuff?)
🔵 1. TradingView + Custom AI Scripts
Tons of Pine Script-based AI tools out there. They:
Highlight where bulls/bears are taking over
Free scripts for reversal alerts, color/volume signals, even heatmaps
Pro tip: Search for “Smart Candle Analyzer” or “Color Momentum AI” in indicators.
🟢 2. TrendSpider
Their AI hunts for:
Color flips, reversals, volume surges
Auto-highlights breakout or reversal spots
Free trial if you wanna test the waters
🔴 3. Finviz + AI Browser Extensions
Basic, but you get quick candlestick heatmaps.
Layer on browser plugins with AI and you’ve got a slick combo for visual cues.
Perfect for beginners.
🟡 4. StockGPT & ChatGPT Plugins
Feed in your candle data and let OpenAI do the hard thinking.
Analyze sequences, code up your own ideas in Python, whatever you want.
🔥 Why Bother With AI? Here’s What You Get
No more emotional freak-outs when you see a streak of red
AI calls out real momentum shifts—no more guessing if that color flip is just noise
Better trade timing—AI’s got your back on entries/exits
Can you watch 100 charts at once? AI can
Custom alerts, so you never miss that critical color change
🎓 Candlestick Color Patterns AI Can Sniff Out All Day
Bullish Engulfing: Red then mega green—bulls flexing
Bearish Engulfing: Green then big red—bears bite back
Doji Reversal: Colorless, market’s confused
Marubozu: Full-color, no wicks—pure momentum
Three White Soldiers: Three greens after a downtrend—bulls marching in
Three Black Crows: Three reds after an uptrend—bears crashing the party
AI’s running this scan 24/7. Sleep is for humans.
📉 Color Flips That Scream “Reversal!”
Red → Green Doji: Possible bottom. “Bears chillin’, doji spotted.”
Green → Red Hammer: Rally losing steam. “Sell pressure, top candle.”
5+ Greens → Red: Bulls might be winded. “Watch for volume drop.”
Repeat dojis: Market’s stuck. “Sideways city, don’t jump in yet.”
AI: “Yup, I’ll handle the pattern hunting. You do the trading.”
⚙️ How To Actually Use AI For Color Analysis (Not Just Talk About It)
✅ 1. Pick Your Timeframe
Day trading? 5 or 15 min
Swing? 1H, 4H, daily
Long-term? Weekly
✅ 2. Turn On AI Color Alerts
Find/enable tools like “Candle Pattern Analyzer.”
Set your alerts for:
Color changes after a streak (3+ in a row)
Reversal candles with volume
When multiple timeframes match up
✅ 3. Confirm With Volume or Trendline
AI’s great, but you still gotta check:
Is the move breaking out?
Volume backing it up?
Any trendline or resistance in the way?

