The Best Free AI for Trading Strategies Visualization in 2025
In 2025, it’s not enough to think your trading strategy works—you need to see it in action. Whether you’re swing trading forex, day trading crypto, or managing a stock portfolio, visual clarity is the key to confidence.
Thanks to advancements in artificial intelligence, you can now visualize complex strategies, test them, and adjust them—all without writing code or paying high fees.
This article explores the best free AI for trading strategies visualization, how they work, and how to integrate them into your daily trading routine.
📊 Why Strategy Visualization Matters
A trading strategy is not just a set of rules. It’s a framework that needs to be:
Tested
Refined
Understood visually across timeframes and conditions
Visualizing a strategy helps you:
Spot weak points
Avoid overfitting
Understand market behavior
Gain psychological clarity
And with AI, these steps can be automated, dynamic, and deeply insightful.
🤖 How AI Enhances Trading Strategy Visualization
Here’s what AI-powered tools can do that traditional charting platforms can’t:
1️⃣ Auto-Build Strategy Flowcharts
AI can:
Convert written or logic-based strategies into visual maps
Create if/then logic blocks
Highlight connections between indicators, entry points, and exits
2️⃣ Backtest and Visualize Outcomes
With one click, AI tools:
Backtest strategies across timeframes
Visualize win rate, risk-reward ratio, and drawdowns
Display entry/exit zones on historical charts
3️⃣ Overlay Multiple Strategies
View how two or more strategies interact
Detect conflicts or synergy between trend-following and reversal tactics
Avoid redundancy in your trading plan
4️⃣ Dynamic Strategy Updates
AI adapts strategies as markets evolve:
Learns from new data
Optimizes parameters based on recent volatility
Keeps visuals relevant without reprogramming
🧰 Top Free AI Tools for Trading Strategies Visualization
Below are free or freemium platforms that allow for rich visualization of trading strategies using AI.
✅ 1. TradingView + AI-Powered Community Scripts
Best for: Visualizing custom indicators and community AI models
Pine Script + public AI strategies
Visual chart overlays for entries, exits, S/R, volume signals
Multi-timeframe strategy visual comparisons
Free access to many strategies + chart publishing
🔹 Free Plan Includes: 1 chart layout, 3 indicators per chart, public script access
✅ 2. MetaTrader 5 + Free AI Expert Advisors (EAs)
Best for: Strategy visualization with automation
Use AI-coded bots to visualize trade entries/exits
Backtest with graphical performance stats
Free access to AI-based EAs from the marketplace
🔹 Free Plan: MT5 desktop + free EA library
✅ 3. QuantConnect
Best for: Quantitative strategy building + visual testing
AI integrates market data and builds logic flows
Backtests displayed visually via equity curves and heatmaps
Visual step-by-step breakdown of decision trees
🔹 Free Plan: Cloud access with limited live execution
✅ 4. Plotly Dash + ChatGPT + Free Datasets (DIY Approach)
Best for: Custom, visual dashboards (no-code to low-code)
Use ChatGPT to help write visual logic
Build a dashboard showing price action, trades, and signals
Leverage Plotly or Streamlit for powerful strategy visuals
🔹 Free Plan: 100% open-source, customizable, cloud-deployable
✅ 5. FinRL (Open Source AI for Finance)
Best for: AI-generated trading strategies with reinforcement learning
Use pretrained models or create your own
Visualize the logic tree and training evolution
Portfolio performance graphing included
🔹 Free Plan: Fully open-source with community support
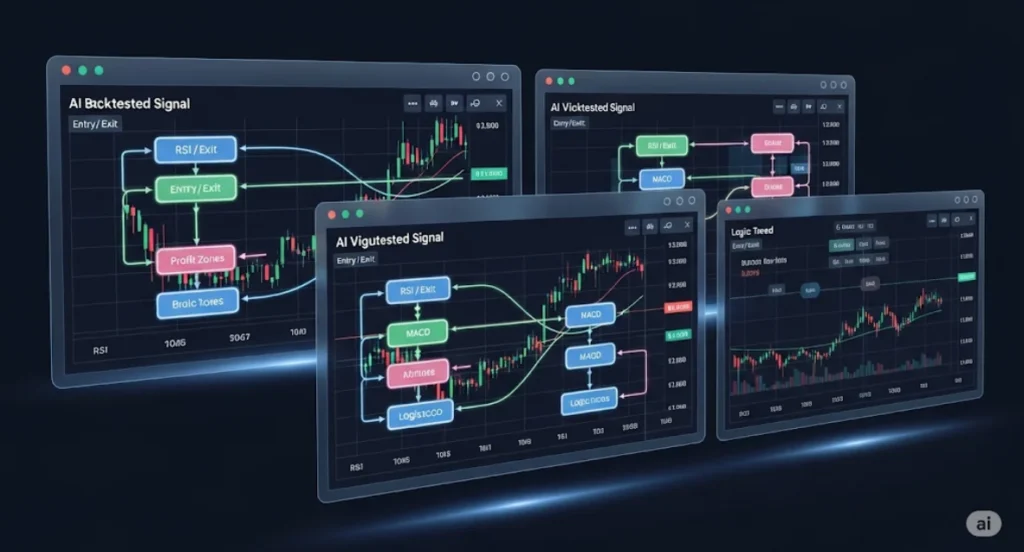
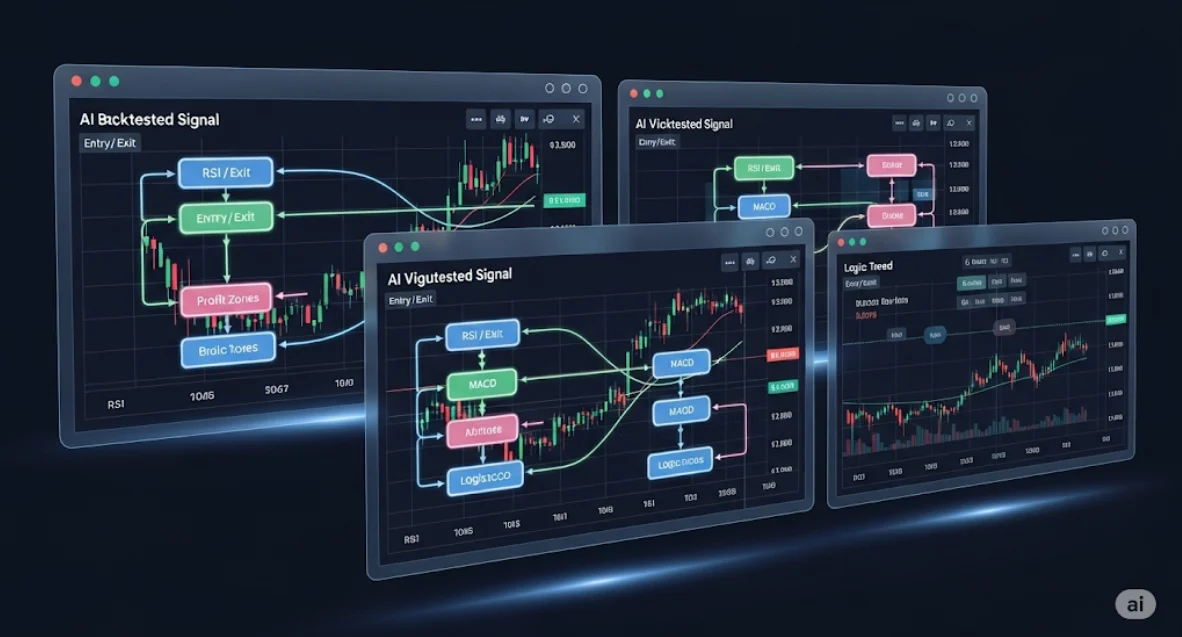
📈 Example: Visualizing a Simple RSI-MACD Strategy with AI
Goal: Buy when RSI < 30 and MACD crosses above signal line. Sell when RSI > 70.
Traditional Method:
Manually scan charts
Draw entries/exits
Guess stop-loss levels
AI Visualization:
✅ Auto plots RSI + MACD cross
✅ Highlights entry points with arrows
✅ Tracks outcome of each trade
✅ Shows profit/loss zones in red/green
✅ Strategy performance: +12.4% over 90 days
🔍 Key Features to Look for in AI Visualization Tools
| Feature | Why It Matters |
|---|---|
| Backtest engine | Test strategy before using real capital |
| Visual overlays | Easily spot how/where signals triggered |
| Trade log integration | View each signal’s ROI and drawdown |
| Multi-strategy layer | Combine trend and reversal ideas visually |
| AI optimization | Tune parameters automatically based on market change |
| Community scripts | Learn and clone strategies that already work |
📊 Types of Strategies That Benefit from AI Visualization
| Strategy Type | Visualization Advantage |
|---|---|
| Trend-following | Easy to spot directional confluence |
| Mean reversion | Confirm bounce levels and zone success |
| Breakout | Highlight false vs real breakouts |
| News-based | AI sentiment overlays + reaction mapping |
| Volume-based | Show price/volume divergence patterns |
🔗 Related Reads You Might Like:

