Introduction: See Market Depth with AI Volume Profiles 🚀
Ever wondered where the real market action is happening? Knowing Where Is the Most Trading occurring helps traders spot key support, resistance, and price levels where institutions and smart money engage the most.
The traditional Volume Profile tool reveals this, but drawing and interpreting it manually takes skill and time. Luckily, artificial intelligence is transforming this process.
With AI-Powered Volume Profile: Where Is the Most Trading, AI tools automatically visualize the most traded price zones—helping traders find hidden support, resistance, and optimal trade entries across stocks, crypto, forex, and commodities.
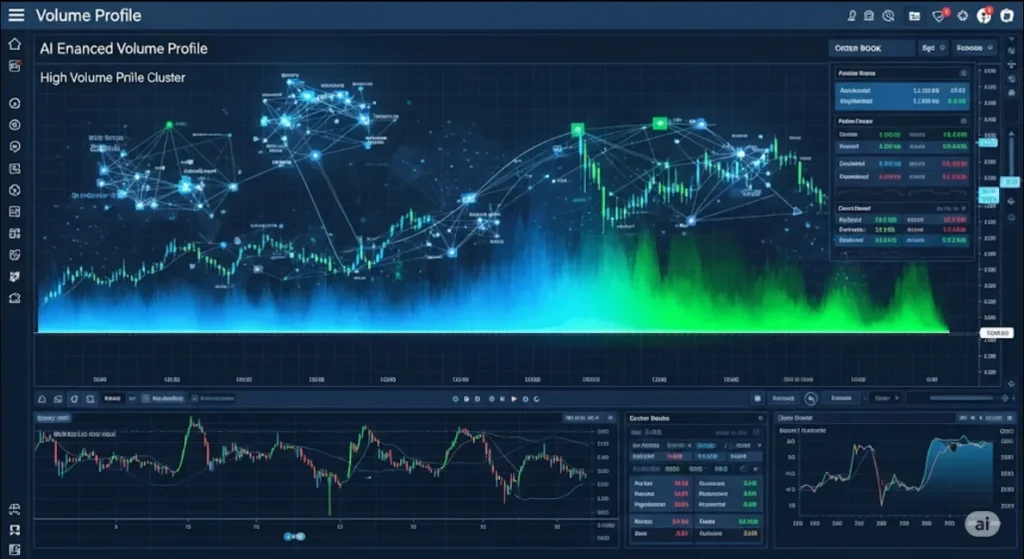
What Is Volume Profile? Market Insights at a Glance 📊
Volume Profile is a powerful technical tool that:
✅ Shows how much trading volume occurred at each price level
✅ Reveals price zones of heavy market activity (high-volume nodes)
✅ Highlights areas where buyers and sellers agreed the most
✅ Identifies support and resistance based on volume concentration
But without AI, analyzing Volume Profile requires:
⚡ Manual chart adjustments
⚡ Visual interpretation of complex data
⚡ Constant monitoring for shifting volume zones
AI-Powered Volume Profile: Where Is the Most Trading simplifies this with real-time automation.
How AI Enhances Volume Profile Analysis 🤖
Manual Volume Profile has limitations—AI eliminates them by:
✅ Automatically scanning charts for high-volume price levels
✅ Highlighting key support, resistance, and fair value zones
✅ Updating Volume Profile in real time across timeframes
✅ Combining volume data with price action and trend detection
✅ Sending alerts when price approaches high-volume zones
With AI-Powered Volume Profile: Where Is the Most Trading, you instantly know where market activity clusters—boosting trade accuracy.
Best Free AI Tools for Volume Profile Detection 🛠️
Discover platforms that showcase AI-Powered Volume Profile: Where Is the Most Trading:
1️⃣ TradingView with AI-Enhanced Volume Profile Indicators
Displays real-time Volume Profile on charts
AI highlights high-volume nodes and price clusters
Applicable to stocks, forex, crypto, and commodities
2️⃣ TrendSpider AI Charting (Free Trial Available)
AI auto-detects Volume Profile zones across assets
Combines volume data with technical analysis for confirmation
Alerts traders to key price interaction zones
3️⃣ Bookmap Free AI Heatmaps (Basic Version)
Visualizes real-time volume and liquidity zones
AI heatmaps highlight order flow around key price levels
Ideal for spotting hidden support, resistance, and large trader activity
4️⃣ Finviz AI-Enhanced Screener with Volume Filters
Screens for stocks with high relative volume near critical levels
Helps identify volume-supported breakouts or reversals
These tools demonstrate AI-Powered Volume Profile: Where Is the Most Trading for smarter technical analysis.
Step-by-Step: Using AI for Volume Profile Insights 💡
Here’s how to simplify market depth analysis with AI:
Step 1: Open your AI-supported platform (e.g., TradingView, TrendSpider)
Step 2: Select your preferred market (stocks, crypto, forex)
Step 3: Apply AI Volume Profile indicators
Step 4: AI highlights price levels with the most trading activity
Step 5: Watch for price action around high-volume nodes (support/resistance)
Step 6: Use these insights to plan entries, exits, or stop-loss zones
With AI-Powered Volume Profile: Where Is the Most Trading, you visualize market structure instantly.
Example: Finding High-Volume Zones on Bitcoin 📈
Imagine analyzing BTC/USD:
✅ AI draws Volume Profile across recent price history
✅ Highlights $28,500 as a high-volume node—strong market agreement
✅ Price approaches $28,500, showing buyer/seller battle
✅ You wait for a breakout or bounce with AI-confirmed volume support
This showcases AI-Powered Volume Profile: Where Is the Most Trading for improved market clarity.
Benefits of AI-Powered Volume Profile Tools 🚀
Traders rely on AI-Powered Volume Profile: Where Is the Most Trading for:
✅ Faster, more accurate identification of key price zones
✅ Reduced guesswork around support and resistance
✅ Real-time volume visualization for better timing
✅ Enhanced understanding of market structure
✅ Applicability across stocks, forex, crypto, and futures
AI transforms complex volume analysis into simple, actionable insights.
Pro Tips for Maximizing AI Volume Profile Insights 💡
✔ Combine Volume Profile with trend indicators for stronger setups
✔ Use high-volume zones as potential entry, exit, or stop-loss levels
✔ Watch for price rejection or acceptance around volume nodes
✔ Apply AI Volume Profile across multiple timeframes
✔ Confirm high-volume zones with price action or order flow
AI-Powered Volume Profile: Where Is the Most Trading is most effective when integrated into a complete trading strategy.
Limitations to Keep in Mind ⚠️
While AI enhances Volume Profile analysis, remember:
⚡ Volume data differs across brokers and exchanges
⚡ High-volume zones aren’t guarantees—use confirmations
⚡ AI simplifies detection but can’t predict all market moves
⚡ Free platforms may limit full Volume Profile features
AI adds efficiency but sound trading decisions remain essential.
Conclusion: Smarter Market Analysis with AI Volume Profiles 🏆
With AI-Powered Volume Profile: Where Is the Most Trading, traders can:
✅ Visualize market hotspots instantly
✅ Identify key support, resistance, and fair value areas
✅ Trade with greater confidence and precision
✅ Reduce guesswork around high-volume price zones
Ready to see where the real market action happens? Let AI show you Where Is the Most Trading—and level up your technical analysis today.
🔗 Related Reads You Might Like:


Pingback: Mastering AI-Generated Channel Lines on Charts for Smarter Trading (2025) - Trade Pluse Ai