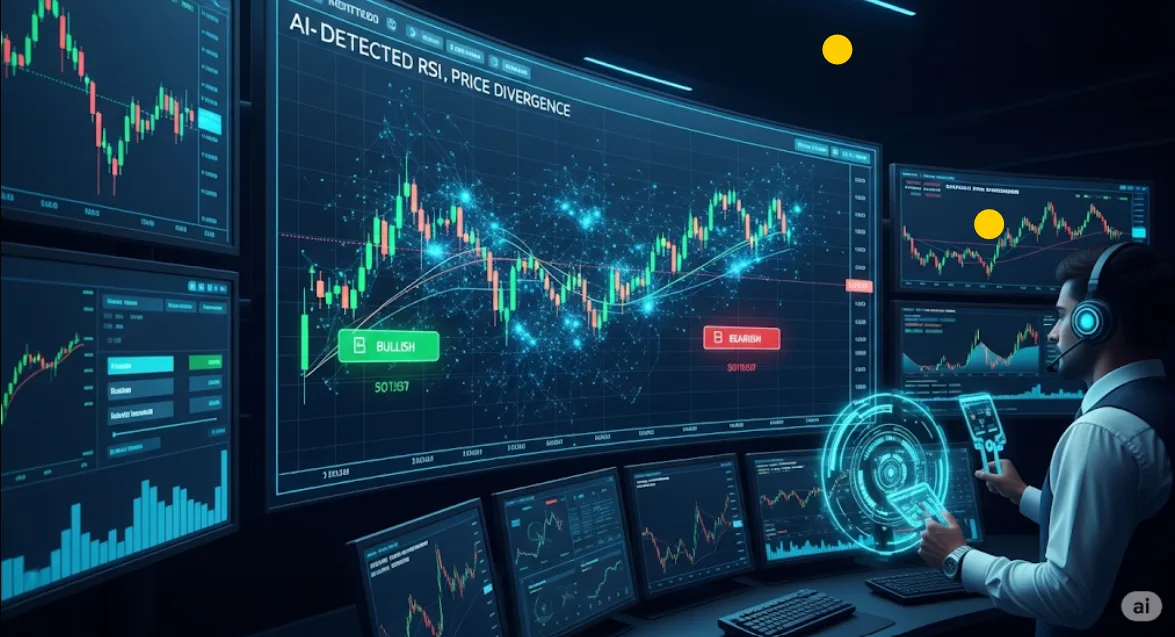
In trading, price alone doesn’t always tell the full story. Sometimes, hidden momentum shifts occur beneath the surface—and spotting them early can unlock powerful opportunities. That’s where AI-Driven Divergence Detection: RSI vs. Price comes into play.
Divergence between price and the Relative Strength Index (RSI) is a classic signal of potential trend reversals. But manually tracking these setups? Time-consuming, subjective, and easy to miss.
With modern AI tools, traders can now automatically detect bullish and bearish divergence—getting real-time alerts when price and momentum disagree. Whether you’re trading stocks, crypto, forex, or commodities, AI makes divergence detection simple, accurate, and beginner-friendly.

What is Divergence? RSI vs. Price Explained 📊
Divergence occurs when price movement and momentum (measured by RSI) move in opposite directions:
✅ Bullish Divergence: Price makes lower lows, but RSI makes higher lows — Possible reversal upward
✅ Bearish Divergence: Price makes higher highs, but RSI makes lower highs — Potential trend weakness or downside
These hidden clues often precede:
✔ Reversals in trend
✔ Exhaustion of momentum
✔ Entry or exit opportunities
With AI-Driven Divergence Detection: RSI vs. Price, these subtle patterns are identified automatically—giving traders a technical edge.
Why AI Enhances Divergence Detection 🤖
Manual divergence detection requires:
⚡ Constant monitoring of charts
⚡ Comparing price swings to RSI movement
⚡ Experience to spot subtle discrepancies
AI simplifies this by:
✅ Scanning multiple charts and timeframes simultaneously
✅ Highlighting confirmed bullish or bearish divergences visually
✅ Sending real-time alerts for actionable setups
✅ Filtering out weak or false signals using historical data
✅ Providing beginner-friendly, data-backed insights
With AI-Driven Divergence Detection: RSI vs. Price, traders can react faster and more confidently.
Best Free AI Tools for RSI vs. Price Divergence Detection 🛠️
Here are reliable platforms for AI-Driven Divergence Detection: RSI vs. Price:
1️⃣ TradingView with AI Divergence Indicators
AI-powered scripts highlight RSI divergences in real-time
Visual chart markers for easy identification
Applicable to stocks, crypto, forex
2️⃣ TrendSpider AI Charting (Free Trial Available)
Fully automated detection of bullish and bearish divergence
Combines RSI, price action, and trend context
Real-time alerts for confirmed setups
3️⃣ Autochartist AI Scanner (Free via Brokers)
AI spots hidden divergences and reversal zones
Alerts traders to potential trend changes
Works for forex, stocks, and crypto
4️⃣ Finviz AI-Enhanced Screener
Flags divergence conditions across thousands of assets
Beginner-friendly interface with clear visual signals
These tools simplify AI-Driven Divergence Detection: RSI vs. Price for all trader levels.
Step-by-Step: Using AI to Detect RSI vs. Price Divergence 💡
Here’s how to incorporate AI-powered divergence into your strategy:
Step 1: Open your AI-supported charting platform (e.g., TradingView, TrendSpider)
Step 2: Choose your market (stocks, forex, crypto)
Step 3: Activate AI-driven divergence detection
Step 4: AI highlights bullish or bearish divergence visually
Step 5: Receive alerts for potential reversals
Step 6: Confirm with trendlines, support/resistance, or volume indicators
With AI-Driven Divergence Detection: RSI vs. Price, hidden reversal setups become crystal clear.
Example: AI Spots Bullish Divergence on Bitcoin 📈
Imagine analyzing BTC/USD:
✅ Price makes new lower lows
✅ RSI, however, forms higher lows — classic bullish divergence
✅ AI highlights the setup and sends an alert
✅ You prepare to enter a long position as momentum strengthens
This illustrates how AI-Driven Divergence Detection: RSI vs. Price helps traders anticipate market reversals with confidence.
Benefits of AI-Powered Divergence Detection 🚀
Traders gain a competitive advantage with AI-Driven Divergence Detection: RSI vs. Price:
✅ Automatic identification of bullish and bearish divergence
✅ Reduced reliance on subjective manual chart reading
✅ Improved timing for entries and exits
✅ Real-time alerts keep you informed without constant monitoring
✅ Works across stocks, forex, crypto, and commodities
AI translates complex technical patterns into simple, actionable signals.
Pro Tips for Maximizing AI Divergence Tools 💡
✔ Combine AI divergence detection with trend confirmation for higher accuracy
✔ Watch for volume support during divergence setups
✔ Use multiple timeframes to validate strong signals
✔ Confirm divergence with candlestick patterns or moving averages
✔ Practice with demo accounts before applying AI tools in live markets
AI-Driven Divergence Detection: RSI vs. Price works best as part of a complete technical strategy.
Limitations to Be Aware Of ⚠️
While AI boosts divergence detection, keep in mind:
⚡ Divergence isn’t always followed by immediate reversals
⚡ False signals can occur in strong trending markets
⚡ AI provides enhanced detection, not guaranteed outcomes
⚡ Free AI platforms may have feature limitations
AI adds an edge—but sound risk management remains essential.
🔗 Related Reads You Might Like:


Pingback: Best Free AI Tools for Technical Indicator Combinations to Simplify Trading - Trade Pluse Ai